مكتبة المؤشرات و النماذج ....

المتذبذب الرائع (Awesome Indicator)


الغرض منه
متذبذب بيل ويليامس يعكس تغيرات محددة في القوة المحركة للسوق ، الأمر الذي يساعد على تحديد قوة المسار ، و من ضمنه نقاط تشكله و انقلابه.

كيفية استخدام المتذبذب الرائع(Awesome Oscillator) على منصة التداول

forex_market_video.jpg


للمزيد من المعلومات حول كيفية تعيين المؤشر على المنصة ، من فضلك ، اضغط هنا

من أجل تحسين تداولاتك

قم باختبار المؤشر

استخدامه
يمكن تمييز الاشارات الاساسية التالية :

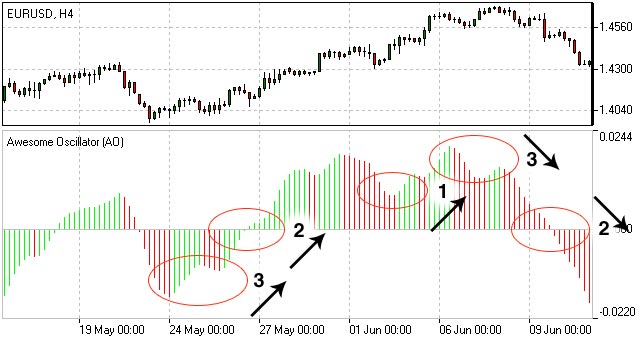
  1. الصحن. هو شكل مكون من ثلاث قضبان متوالية فوق خط الصفر ، اثنان منها باللون الأحمر و الثالث باللون الأخضر ، مع العلم أن الأول ذو اللون الأحمر و الثالث ذو اللون الأخضر – كلاهما فوق الثاني ذو اللون الأحمر أمر يعتبر اشارة واضحة للشراء و عندما يكون التشكيل ، ذو لون مضاد و مقلوب عامودياً بالنسبة لخط الصفر فهذه اشارة للبيع.
  2. تقاطع خط الصفر إن المخطط البياني المتقاطع مع خط الصفر من المنطقة السلبية نحو المنطقة الايجابية ( المتزايد ) يعطينا اشارة واضحة للشراء ، عندما التقاطع مع خط الصفر من المنطقة الايجابية نحو المنطقة السلبية ( الهابطة ) ، يعتبر اشارة نحو البيع.
  3. قمّتان يعطي المؤشر اشارة للشراء اثناء تكون هذا الشكل من قاعين متتاليين في المنطقة السالبية ، عندما يكون الأول فوق الثاني. و ستكون هناك اشارة للبيع عندما يتكون هذا الشكل من قمتين متتاليتين في المنطقة الايجابية ، حيث يكون الثاني أدنى من الأول.
AwesomeOscillator.jpg

كيفية حسابه
متذبذب بيل ويليامس يحتسب عن طريق الفارق بين الفترة 5 و الفترة 34 للمتوسط البسيط ، المتشكلان بالأسعار الوسطى للقضبان(H+L)/2.

السعر الوسطي = (قمة+قاع)/2

AO = SMA(السعر الوسطي, 5)-SMA(السعر الوسطي, 34)

كيفية إنشاء المتذبذب الرائع(Awesome Oscillator) في منصة التداول

https://www.ifcmarkets.net/ntx-indicators/awesome-oscillator
 
بسم الله الرحمن الرحيم

السلام عليكم و رحمة الله و بركاته


الديفرجنس و أنواعه .. Divergence

7351_1272998688.jpg


الديفرجنس , احد الادوات الفنية القوية جداً فى أسواق المالبشكل عام حيث توضح الإختلاف بين حركة السعر Price Action بالمقارنة مع احد مؤشرات التذبذب Oscillator مثل الماكد و مؤشر القوة النسبية و مؤشر ستوكاستيك .

س / لماذا نعتمد على الديفرجنس فى الفوركس ؟

ج / لانه يساعدنا فيما يلى :

1 – تقليل المخاطرة عند الشراء بالقرب من دعم ( قاع ) أو عند البيع بالقرب من مقاومة ( قمة ) .
2 – تنبيه المتاجر إلى الخروج المبكر من الصفقات قبل ان يعكس السوق عليك و ترى الخسائر بدل من الارباح .
3 – الدخول المبكر فى الصفقات و جنى المزيد من الارباح .

ذكرنا اعلاه ان الديفرجنس يوضح بشكل عام الإختلاف بين حركة السعر بالمقارنة مع احد مؤشرات التذبذب حيث نعلم انه عندما تتكون قمة أثناء حركة السعر نجد انه من المعتاد و الطبيعى ان يقابلها قمة آخرى أثناء حركة المؤشر فى نفس الوقت و إذا تكون قاع أثناء حركة السعر , أيضاً يقابل هذا القاع – قاع آخر يتكون أثناء حركة المؤشر .. ممتاز إلى الآن .

ما رأيك الآن باضافة قمة آخرى إلى القمة السابقة و قاع آخر إلى القاع السابق ؟

تتسأل الآن : طبعاً إذا تكونت قمة أعلى من قمة أو قمة أقل من قمة أو قاع أعلى من قاع أو قاع أقل من قاع سيتكون نفس السيناريو بطبيعة الحال على المؤشر .. صحيح , من الطبيعى ان يحدث الكلام السابق و لكن إنتبه :

ماذا لو لم يحدث ما حدث أثناء حركة السعر على المؤشر !!

7351_1272993951.jpg


ببساطة شديدة نقول فى هذه الحالة ان هناك إختلاف بين حركة السعر و الموشر ( Divergence ) أنظر إلى الشكل ادناه :


المثال السابق يمثل حالة واحدة فقط من الاربع حالات لاختلاف حركة السعر عن المؤشر و بعد ان تعرفنا على حركة السعر و المؤشر و كيف يتكون الديفرجنس أو الإختلاف بينهم , سنشرح الآن حالات الديفرجنس باستفاضة شديدة خلال السطور القادمة بإذن الله .

أنواع الديفرجنس :
الديفرجنس العادى Regular Divergence و يتكون من :

1 - ديفرجنس عادى ( سلبى ) Regular Bearish Divergence

2 – ديفرجنس عادى ( ايجابى ) Regular Bullish Divergence
[/U]


الديفرجنس المخفى Hidden Divergence و يتكون من :

1 – ديفرجنس مخفى ( سلبى ) Hidden Bearish Divergence

2 – ديفرجنس مخفى ( ايجابى ) Hidden Bullish Divergence


شرح أنواع الديفرجنس :


1 - ديفرجنس عادى ( سلبى ) Regular Bearish Divergence

7351_1272998618.jpg


حركة السعر : قمم صاعدة ( قمة أعلى من الآخرى ) .
حركة المؤشر : قمم هابطة ( قمة أقل من الآخرى ) .
حالة المتاجرة : بيع ( سلبى ) .


2 - ديفرجنس عادى ( ايجابى ) Regular-Bullish-Divergence

7351_1272993865.jpg


حركة السعر : قيعان هابطة ( قاع أقل من قاع ) .
حركة المؤشر : قيعان صاعدة ( قاع أعلى من قاع ) .
حالة المتاجرة : شراء ( ايجابى ) .


3 – الديفرجنس الايجابى ( المخفى ) Hidden-Bullish-Divergence

7351_1272993809.jpg


حركة السعر :
قيعان متصاعدة ( قاع أعلى من قاع ) .
حركة المؤشر :
قيعان هابطة ( قاع أقل من قاع ) .
حالة المتاجرة :
شراء ( ايجابى )


الديفرجنس المخفى ( السلبى ) Hidden-Bearish-Divergence

7351_1272993762.jpg


حركة السعر :
قمم هابطة ( قمة أقل من قمة ) .
حركة المؤشر :
قمة أعلى من قمة ( قمم صاعدة )
حالة المتاجرة :
بيع ( سلبى ) .

صورة توضح بعض أنواع الديفرجنس السابق ذكرها

7351_1272993705.jpg


جدول شامل لجميع أنواع الديفرجنس و حالات المتاجرة


7351_1272993653.jpg


- الديفرجنس أقوى على الفريمات الكبيرة .
- محتمل ان يخطئ الديفرجنس فهو ليس اداة معتمدة تستخدم بمفردها و لكن يجب جمع أكبر قدر من العوامل الفنية التى تؤيد بعضها البعض .
- محتمل ان يعطى الديفرجنس اشارة لانعكاس الاتجاه او استكمال الاتجاه حسب منطقة ظهور الديفرجنس .
- الديفرجنس اداة قوية إذا اجتمعت مع ادوات فنية آخرى فهى تزيد احتمال الوصول للهدف High Probability .
- المؤشر يعطيك قمم و قيعان واضحة , اعتمد عليها فقط ولا تنظر إلى تقاطع المتوسطات التى تظهر أحياناً على بعض المؤشرات مثل الماكد المعدل .
- مؤشرات التذبذب Oscillator من أفضل المؤشرات التى تعطى اشارات صادقة للديفرجنس و منها OsMa , MACD , RSI
تم بحمد الله

جميع الحقوق الادبيه والفكريه محفوظه للاستاذ / شـــادى عبده


https://www.fx-arabia.com/vb/showthread.php?t=14303
 
ما يحك جلدك الا شارتك ...
................... .. فتولى بنفسك جميع أمرك


ما لك الا نفسك .. في توفير احتياجاتك .. و تنفيذ رغباتك ...و تحقيق طموحك ... هذا في الحياة بصورة عامة ..
فشلون في البورصة .. اللي حاط فيها مدخرات العمر .. و تواجه فيها ضعف مستوى الإدارة و الرقابة و متغيرات متسارعة و متلاحقة ..و مخاطر ..تؤثر على قيمتها ارتفاعا او نزولا .....
و ....أخبار ..مشاعر نفسية متقلبة .. مركز مالي .. نظام وحدات .. قرارت الهيئة .. وقف تداول .. انسحاب من الادراج .. و غيره
و
تصريحات الناطقين الرسميين بإسم الاسهم :
السهم رايح قوع .. يتروالي ..اعتقد ..ما أظنتي يطلع ..عينك على ..دقلبازات الجمبازية ( اللي يضللون علشان يتمصلحون )... فوق فوق...أجيليتي ! _ يحط الاسم بس ..الظاهر يبينا نكمل شمعنى
smile.png
_ إحساسي يقول ....و غيره ..


ترى .. في طريقة منظمة و تستند على أسس... و تريحك و تفكك من هذا كله ..


الشارت ... طبجتي ...
smile.png

.....

الطريفة ببساطة : .. اهي الاعتماد على الشارت وحده .. في تبيان مسار السهم الحال و المتوقع ..و تصك اذنك و تفلتر عينك عن ما تقرأ ان صادف و قرأت ..ولا في الاصل الا تقرأه من الاساس ..

cool.png
>> هه فلتر..شلون يعني .. اركب فلتر عليها

يعني .. اجعل بينك و بين ما تقرأ عن الاسهم سدا ..لا يمر منه الا ما يتصل بالمعلومات و الفنيات و النظم ..

cool.png
>> شلون اعتمد على الشارت
eek.png
... و يعدين تعال : اهو شنو فيه أصلا علشان أعتمد عليه upload_2018-8-19_21-55-3.gif.......... خط ينزل و يصعد و بس

خير وسيلة للإقناع اهو الاستدلال بمثال من الواقع .. لنختار شارت سهم .. و نشوف شنقدر نطلع منه .. و نقدر نعتمد عليه ولا لأ ..

بعد شوي أنشر شارت سهم أجيليتي .. مو تقبون على ابو عيد و تخلوني بروحي في المنتدى .. upload_2018-8-19_21-55-3.gif

smile.png
...


.....................
:::::::::::::::::::::::::::::::::::

في الغرب ..تجدهم في القطارات و اماكن الانتظار ... بيدهم كتب يقرؤون فيها .. لا يهدرون الوقت .. فيما حكومة رؤية 2035 .. توقف نشاط الدولة 10 أيام.. يعني تعود الناس على بيئة الهدر


/////////////////م


قبل أن نمضي و تستعرض شارت أحيليتي ..هناك 3 أسس يجب أن تفهمها .. و تتفهمها .. و تقتنع بها مرة و الى الابد كي تتمكن من الاعتماد على الشارت و القواعد الفنية

1 _ أن تستبدل نهجك بالإعتماد على مفاهيم الاقتصاد بنهج الاعتماد على مبادىء التحليل الغني
2 _ أن المتداولين يعبرون عن رؤيتهم و قناعاتهم في وضع السوق من خلال القرارات التي يتخذونها خلال وقت التداول
3 _ أن مجريات التداول الفعلي في السوق و بياناته هي وحدها دون غيرها من تحدد اتجاهه .. و يتم تبيان ذلك من خلال التطبيقات الفنية على الشارت


********** ... السالفة مي سهلة .. غلجة حيل .. تفكر بها ..قولب فيها .. شوف نفسك تقبلها ؟ ..
مطلوب تلتفت عن الأخبار و ضجيجها و المشاعر تجاهها... و .. تصدق و تعتمد على البيانات الفنية حتى لو كانت معاكسة لإخبار و نتائج الشركة .. تقدر ؟ ...مو تقول خنقرى و نشوف .. لا .. لا تتجاوزها .. ترى إن تجاوزتها لن تتمكن من فهم مبادىء التحليل الفني أبدا..أبدا ...

..
 
واحد
و احد شارت ..و صلحو


282820


هذا شارت أجيليتي ... لو تقعد تطالع فيه من الحين لى باكر الصبح ما تطلع منه بشي .. صح


و ين عيل كلام المحللين .. السهم .اخترق ... و السهم عطى اشارة دخول ...و السهم في تشبع بيعي
كل هذا موجود في الشارت .. وين ..لا يكون يجمرون بس ... ما يندرى

هاااا ه..هاه ..هذا الشارت .. وين ..ما ميش .. هه ..تشبع بيعي .. الظاهر الاخ يوعان

شارت أصم .. لا شيء فيه مفيد .. و مستحيل تطلع منه بشي .

هذا ما كنت أتحلطم فيه قبل
smile.png
كل ما فتحت على شارت .. من كثر الإحباط من شكله الخاوي
confused.png


.. و كان تركيزي على أني أجد مصدر يساعدني في البحث عن سهم بسعر مناسب

و الشارت لا يساعد و لا يحزنون ... لا و يزهد الواحد و يملله ...

عاد شلنا بالطلايب على رأي المثل : شلك بالشارت و أهواله ..خلك يم ..أعتقد ..يتروالي ..
eek.png


confused.png
مو عدل يالربع ... ......................
frown.png


smile.png
 
اثنين


282820


لا مو عدل ,,,

شلون نقدر نقرأ شارت دون أن نتعلم ... ما يصير ..

و شلون نصدر حكم عليه بالسلبية و احنا مانعرف نقراه أصلا

شارت أجيليتي هذا نقدر نطلع منه ...

سعر افتتاح السهم ..
أعلى سعر وصل له ..
أدنى سعر وصل له
سعرالإقفال

يعني يفكنا و يوفر علينا عناء استخراج هذه البيانات

و بعد ..
تقدر تطلع منه ...أن شمعة آخر إقفال هي شمعة اسمها ماربوزو و هي تشي بإرتفاع السهم في الحلسة القادمة

و بعد
تقدر تطلع منه ...أن السهم في اتجاه صاعد منذ 3شهور

و بعد
تقدر تعرف مستوى السيولة و هل هي شرائية ام بيعية


هاااا .. و كل يوم تقدر تطلع هذه البيانات

و بعد ... ...


::::::::::::::::::::::


ثلاثة


282824


نرسم خط نطاق صاعد لمسار السهم ... فنكتشف أن السهم قد كسر سلبا خط النطاق .. و أنه قد عاد محاولا الرجوع للسير فوق خط النطاق
فإذا ما أضفنا معلومة الشمعة ... نكون قد حصلنا على دليل ثاني لتوقع الصعود
و إذا أضفنا معلومة آخر خط من خطوط السعر في أن الجلسة كانت شرائية... نكون قد حصلنا على دليل ثالث ..


و بعد

.:::::::::::::::::::::::::::::


282825


نقدر نرسم خط النطاق العلوي الموازي ... فتتشكل قناة صاعدة يسير السهم في نطاقها .. و بالتالي نقدر نعرف اذا السهم غير نطاق اتجاهه ..لإعلى ام لإسفل


و بعد ...


هناك خيارات للبحث في مسار السهم على فترات زمنية متعددة ..
 
مؤشر Detrended Price Oscillator
كتبه: ranaفى: فبراير 17, 2016فى: مؤشراتلا يوجد تعليقات
البريد الالكترونى
مؤشر Detrended Price Oscillator

10799-check-mark-design-2.png
مؤشر( DPO ( Detrended Price Oscillator من المؤشرات التى تتنبأ باتجاه السعر وتحديد ترند جديد تستطيع من خلال المؤشر ان تحدد الاتجاه بسهوله من


▐خلال مستويات المؤشر مستوى 0.008 يدل على تشبع شرائى ومستوى -0.008 تشبع بيعى وعند اختراق مستوى الصفر من اعلى ندخل بيع وعند اختراقه من اسفل ندخل شراء تستطيع تحقيق ربح اكثر من 100 نقطه على الفريمات الكبيره ( اليومى – 4 ساعات ) وتحقيق من 50:20 نقطه على فريم الساعه – 30 دقيقه المؤشر يعمل مع جميع ازواج العملات ولكن الافضل المتاجره بالمؤشر على الازواج الرئيسيه لاحظ على الشارت كيف حقق المؤشر مئات النقاط على فريم الساعه تستطيع استخدام المؤشر سكالبينج لخطف نقاط سريعه على فريم 15 دقيق

11-8.png


المؤشر لزوج aud-usd فريم 4 ساعات

12-4.png


http://3sinvesting.com/fx/2016/02/مؤشر-detrended-price-oscillator/
 
ADX: The Trend Strength Indicator
By Candy Schaap | Updated February 17, 2018 — 8:24 PM EST
SHARE


Trading in the direction of a strong trend reduces risk and increases profit potential. The average directional index (ADX) is used to determine when the price is trending strongly. In many cases, it is the ultimate trend indicator. After all, the trend may be your friend, but it sure helps to know who your friends are. In this article, we'll examine the value of ADX as a trend strength indicator.

Introduction to ADX
ADX is used to quantify trend strength. ADX calculations are based on a moving average of price range expansion over a given period of time. The default setting is 14 bars, although other time periods can be used. ADX can be used on any trading vehicle such as stocks, mutual funds, exchange-traded funds and futures. (For background reading, see: Exploring Oscillators and Indicators: Average Directional Index.)

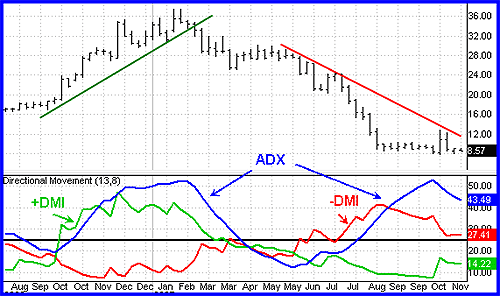
ADX is plotted as a single line with values ranging from a low of zero to a high of 100. ADX is non-directional; it registers trend strength whether price is trending up or down. The indicator is usually plotted in the same window as the two directional movement indicator (DMI) lines, from which ADX is derived (Figure 1).

For the remainder of this article, ADX will be shown separately on the charts for educational purposes.

AT-ADX1.gif

Source: TDAmeritrade Strategy Desk
Figure 1: ADX is non-directional and quantifies trend strength by rising in both uptrends and downtrends.
When the +DMI is above the -DMI, prices are moving up, and ADX measures the strength of the uptrend. When the -DMI is above the +DMI, prices are moving down, and ADX measures the strength of the downtrend. Figure 1 is an example of an uptrend reversing to a downtrend. Notice how ADX rose during the uptrend, when +DMI was above -DMI. When price reversed, the -DMI crossed above the +DMI, and ADX rose again to measure the strength of the downtrend.

[The ADX indicator is a great way to determine when a price is trending, but how do you determine the optimal entry and exit points for a trade? The Technical Analysis course on the Investopedia Academy provides a great introduction to the wider field of technical analysis and explains how indicators like the ADX indicator can work together to find profitable trades.]

Quantifying Trend Strength
ADX values help traders identify the strongest and most profitable trends to trade. The values are also important for distinguishing between trending and non-trending conditions. Many traders will use ADX readings above 25 to suggest that the trend is strong enough for trend-trading strategies. Conversely, when ADX is below 25, many will avoid trend-trading strategies.

ADX Value Trend Strength
0-25 Absent or Weak Trend
25-50 Strong Trend
50-75 Very Strong Trend
75-100 Extremely Strong Trend
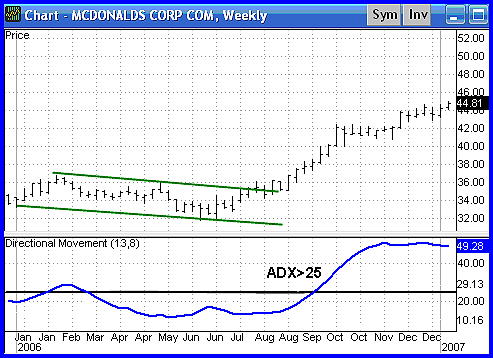
Low ADX is a usually a sign of accumulation or distribution. When ADX is below 25 for more than 30 bars, price enters range conditions, and price patterns are often easier to identify. Price then moves up and down between resistance and support to find selling and buying interest, respectively. From low ADX conditions, price will eventually break out into a trend. In Figure 2, price moves from a low ADX price channel to an uptrend with strong ADX.

AT-ADX2.gif

Source: TDAmeritrade Strategy Desk
Figure 2: When ADX is below 25, price enters a range. When ADX rises above 25, price tends to trend.
AT-ADX3.gif

Source: TDAmeritrade Strategy Desk
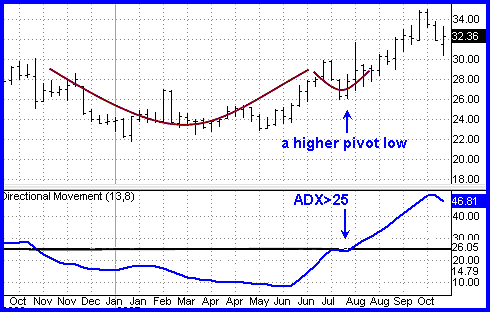
Figure 3: Periods of low ADX lead to price patterns. This chart shows a cup and handleformation that starts an uptrend when ADX rises above 25.
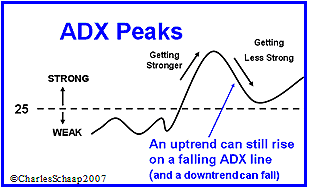
The direction of the ADX line is important for reading trend strength. When the ADX line is rising, trend strength is increasing, and the price moves in the direction of the trend. When the line is falling, trend strength is decreasing, and the price enters a period of retracement or consolidation. (For more on this topic, check out: Retracement or Reversal: Know the Difference.)

A common misperception is that a falling ADX line means the trend is reversing. A falling ADX line only means that the trend strength is weakening, but it usually does not mean the trend is reversing, unless there has been a price climax. As long as ADX is above 25, it is best to think of a falling ADX line as simply less strong (Figure 4).

AT-ADX4.gif

Source: TDAmeritrade Strategy Desk
Figure 4: When ADX is below 25, the trend is weak. When ADX is above 25 and rising, the trend is strong. When ADX is above 25 and falling, the trend is less strong.
Trend Momentum
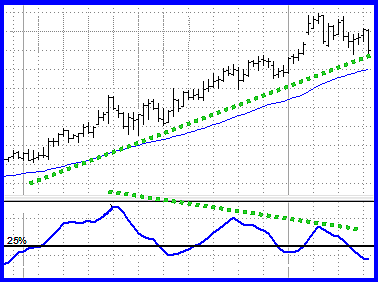
The series of ADX peaks are also a visual representation of overall trend momentum. ADX clearly indicates when the trend is gaining or losing momentum. Momentum is the velocity of price. A series of higher ADX peaks means trend momentum is increasing. A series of lower ADX peaks means trend momentum is decreasing. Any ADX peak above 25 is considered strong, even if it is a lower peak. In an uptrend, price can still rise on decreasing ADX momentum because overhead supply is eaten up as the trend progresses (Figure 5).

AT-ADX5.gif

Source: TDAmeritrade Strategy Desk
Figure 5: ADX peaks are above 25 but getting smaller. The trend is losing momentum but the uptrend remains intact.
Knowing when trend momentum is increasing gives the trader confidence to let profits run instead of exiting before the trend has ended. However, a series of lower ADX peaks is a warning to watch price and manage risk. The best trading decisions are made on objective signals, not emotion.

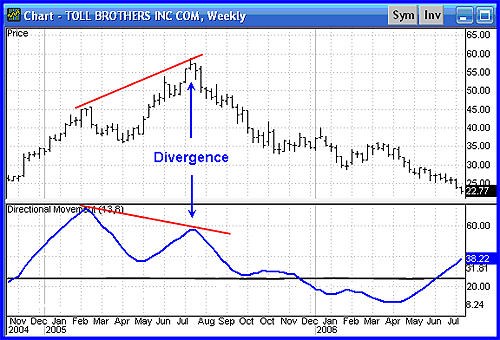
ADX can also show momentum divergence. When price makes a higher high and ADX makes a lower high, there is negative divergence, or non-confirmation. In general, divergence is not a signal for a reversal, but rather a warning that trend momentum is changing. It may be appropriate to tighten the stop-loss or take partial profits. (For more, see: Divergences, Momentum and Rate of Change.)

Any time the trend changes character, it is time to assess and/or manage risk. Divergence can lead to trend continuation, consolidation, correction or reversal (Figure 6).

AT-ADX6.gif

Source: TDAmeritrade Strategy Desk
Figure 6: Price makes a higher high while ADX makes a lower high. In this case, the negative divergence led to a trend reversal.
Strategic Use of ADX
Price is the single most important signal on a chart. Read price first, and then read ADX in the context of what price is doing. When any indicator is used, it should add something that price alone cannot easily tell us. For example, the best trends rise out of periods of price range consolidation. Breakouts from a range occur when there is a disagreement between the buyers and sellers on price, which tips the balance of supply and demand. Whether it is more supply than demand, or more demand than supply, it is the difference that creates price momentum.

Breakouts are not hard to spot, but they often fail to progress or end up being a trap. But ADX tells you when breakouts are valid by showing when ADX is strong enough for price to trend after the breakout. When ADX rises from below 25 to above 25, price is strong enough to continue in the direction of the breakout.

ADX as a Range Finder
Conversely, it is often hard to see when price moves from trend to range conditions. ADX shows when the trend has weakened and is entering a period of range consolidation. Range conditions exist when ADX drops from above 25 to below 25. In a range, the trend is sideways and there is general price agreement between the buyers and sellers. ADX will meander sideways under 25 until the balance of supply and demand changes again. (For more, see: Trading Trend or Range?)

ADX gives great strategy signals when combined with price. First, use ADX to determine whether prices are trending or non-trending, and then choose the appropriate trading strategyfor the condition. In trending conditions, entries are made on pullbacks and taken in the direction of the trend. In range conditions, trend-trading strategies are not appropriate. However, trades can be made on reversals at support (long) and resistance (short).

The Bottom Line: Finding Friendly Trends
The best profits come from trading the strongest trends and avoiding range conditions. ADX not only identifies trending conditions, it helps the trader find the strongest trends to trade. The ability to quantify trend strength is a major edge for traders. ADX also identifies range conditions, so a trader won't get stuck trying to trend trade in sideways price action. In addition, it shows when price has broken out of a range with sufficient strength to use trend-trading strategies. ADX also alerts the trader to changes in trend momentum, so risk management can be addressed. If you want the trend to be your friend, you'd better not let ADX become a stranger. (For further reading, check out: Keep It Simple and Trade With the Trend.)


Read more: ADX: The Trend Strength Indicator https://www.investopedia.com/articles/trading/07/adx-trend-indicator.asp#ixzz5OuAhGOY3
Follow us: Investopedia on Facebook
 
122815-head-and-shoulders-nbr-1.png

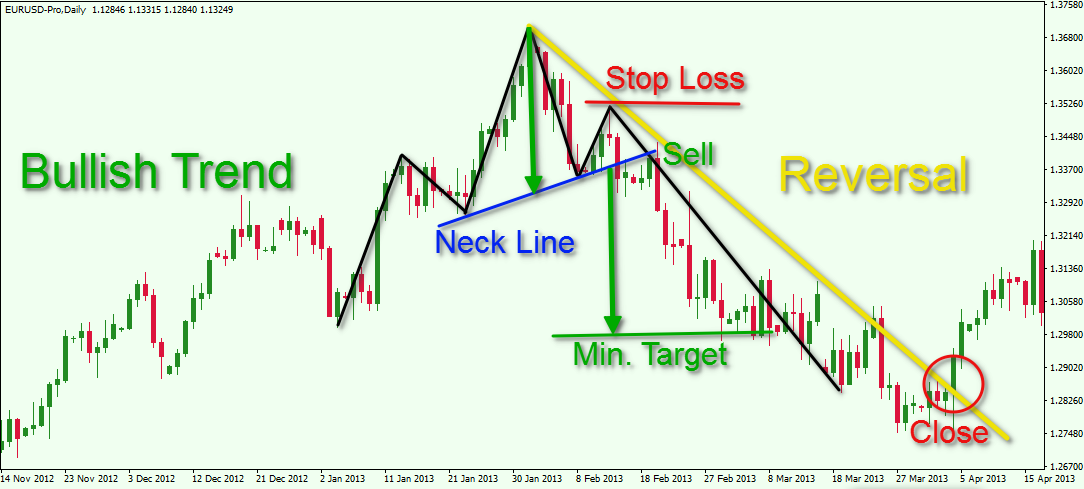
Head & Shoulders Pattern In Technical Analysis Charting


Head-and-Shoulders-Trading-Example.png


Keys to Identifying and Trading the Head and Shoulders Pattern ...


Basic Principles of Technical Analysis in the FX Market

FOREX TRADING ARTICLES

Twitter 0Tweet !function(d,s,id){var js,fjs=d.getElementsByTagName(s)[0];if(!d.getElementById(id)){js=d.createElement(s);js.id=id;js.src="//platform.twitter.com/widgets.js";fjs.parentNode.insertBefore(js,fjs);}}(document,"script","twitter-wjs");" style="box-sizing: border-box; position: absolute; top: 12px; left: 16px; width: 105px; min-height: 15px; text-align: left; line-height: 15px; bottom: 10px;">Facebook 0Google+0 (function() { var po = document.createElement("script"); po.type = "text/javascript"; po.async = true; po.src = "https://apis.google.com/js/plusone.js"; var s = document.getElementsByTagName("script")[0]; s.parentNode.insertBefore(po, s); })(); " style="box-sizing: border-box; position: absolute; top: 12px; left: 16px; width: 105px; min-height: 15px; text-align: left; line-height: 15px; bottom: 10px;">
When you trade Forex, you should carefully implement an analytical approach as part of your trading strategy. If you have been around the markets for any length of time, you will have heard of technical analysis. This is one of the two primary forms of currency analysis. And, I believe, the more essential part of the trader’s arsenal. So in this article, we are going to discuss what technical analysis is and how you can incorporate it into your trade analysis for better market timing.

Download the short printable PDF version summarizing the key points of this lesson….Click Here to Download
What is Technical Chart Analysis?
Technical analysis, as it relates to forex, is an on-chart examination of the respective currency pair in an effort to find price patterns that can provide clues into future price movement. Fx technical analysis relies on past Forex data, which is taken into consideration when determining potential support and resistance levels. It is commonly accepted that if a Forex pair bounces from a specific level orpivot point, the pair is likely to conform to this level in future.

As such technical trading at its most basic level involves using horizontal and diagonal lines in an attempt to find and trade support and resistance zones . This type of trading is often referred to as pure price action trading. Other assistant tools, which technical traders sometimes use, are technical analysis indicators.

By combining different technical tools, Forex traders are able to perform a detailed chart analysis of Forex pairs to ultimately hone in on the best trading opportunities on their chosen timeframe.


Support and Resistance as a Primary Technical Analysis Tool
If you want to learn technical analysis, you should start with understanding what support and resistance is.

Support and resistance are psychological levels on the chart. These are levels which the price action tends to conform to. If the price creates a top at a certain exchange rate, an eventual return to this level often causes the price action to hesitate. Sometimes the price breaks the level and continues its progress.

However, in many cases reaching an already created level might cause the price to bounce. For this reason traders use support and resistance levels for entry and exit points of their trades. But what is the difference between support and resistance?

Support Levels
A price support level is a specific level on the chart, which the price tests while it is decreasing. In this manner, supports are located below the price action. If the price meets a support on its way down, there is a good chance that the price will bounce off in a bullish direction.

On the other hand, if the price breaks a crucial support area on the chart, then we expect the decrease to continue to the next lower level of price support.

Imagine you are in a short trade in the EUR/USD and the pair is decreasing in your favor. Suddenly, the price meets an old support level, which has been tested and has held on prior attempts.

In this case, the respective support level would be a good exit point. You would close your trade in anticipation of a minor or major reversal off the support zone.

Now imagine instead, the price breaks that support. In this case, assuming that your bias is still to the downside, You can reopen your trade in order to catch an eventual further price decrease.

Resistance Levels
Resistances on the chart act absolutely the same way as supports, but in the opposite direction. When the price is increasing and starts hesitating at a certain level, we say that the price has found resistance. In the case of another price interaction with this same resistance area, we might expect another bounce from this level.

Same as with support levels, if the price breaks a resistance level, we expect a continuation of the rally. As such, resistance areas are used to set entry and exit points when trading – similar to supports.


Let’s assume you are in a long trade in the GBP/USD, and the price is steadily increasing. The price action then meets a resistance level on the chart.

In this case, this resistance is a good exit point from the trade. You can exit the trade in anticipation of a minor or major reversal off the resistance zone.

However, the price might go through this level, right? If this happens, you can then reopen your trade after the breakout for an attempt to catch a further price increase.

Let’s look at this price chart below, which illustrates support and resistance levels in action:

Technical-Analysis-Support-and-Resistance.jpg


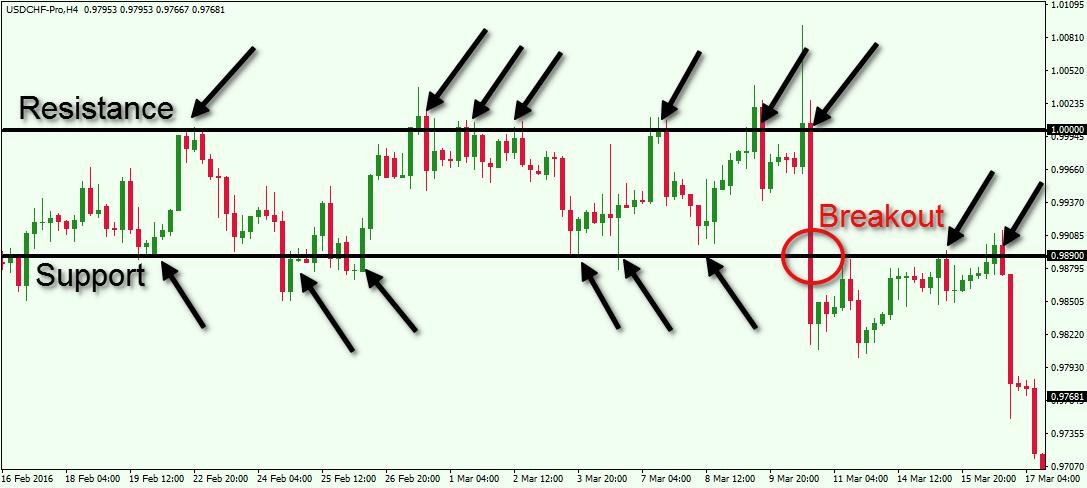
Above you see the H4 chart of the Swissy (USD/CHF) for Feb – Mar, 2016. Note how the price action is squeezed between two well defined levels on the chart. We have the resistance at the level of 1.0000 and the support at 0.9890.

Notice that both levels are many times tested and they both contain the price action for a relatively long time. At the same time, there are a few cases where the price manages to go below the two psychological levels, but proved to be false breakouts. So the bottom line is that the majority of the price action managed to stay within the corridor formed between 1.0000 and 0.9890. The resistance gets tested approximately 7 times and the support about 6 times. The 7th time the price tests the support leads to a real breakout through that level. After breaking the support, the USD/CHF begins a sideways movement and eventually tests the already broken support as a resistance. The price then bounces downwards, creating new lows.

Learn What Works and What Doesn’t In the Forex Markets….Join My Free Newsletter Packed with Actionable Tips and Strategies To Get Your Trading Profitable…..Click Here to Join
Every price bounce from the support at 0.9890 could be used to open long trades, which could be closed when the price interacts with the 1.0000 resistance. In addition, every price interaction with the 1.0000 resistance could be used to open short trades. When the price meets the 0.9890 support you would look to close these trades. Then when you spot the breakout on the support side, you would prepare to go short on an assumption for a further decrease. More aggressive traders would enter on be breakout candle and less aggressive traders would wait for the retest before entering into the short position.

Forex Technical Analysis Using Trend Lines
Another important building block when trading with technical analysis in currency pairs are the use of trend lines. The trend line acts as a diagonal support and resistance which measures the scope of a price tendency (trend). A Trend line is an on-chart straight diagonal line, which connects the tops and/or the bottoms of the price action, depending on the direction of the overall trend. Let’s now dive into the different trend lines you can use on the chart.

Bullish Trend Line
The bullish trend line is a straight line, which connects the sloping candle lows on the chart during an uptrend. In this manner, the bullish trend line is always located below the price action. Since the bullish trendline is located beneath, on its way up the price is frequently bouncing from it. Therefore, the bullish trend line acts as a support for the price movements.

If there is a bullish tendency on the chart, and the price returns to the bullish trend line and bounces upwards, then we have a nice opportunity for a long trade. In this case you can buy the currency pair on an assumption that the price is likely to increase for a new leg up. However, if the price goes through the bullish trendline, then we say we have a bearish breakout in the trend. When a bullish trend gets broken, we expect the price to change direction and begin to move to the downside.


imp.php

Bearish Trend Line
The bearish trend line acts the same way as the bullish trend line, but in the opposite direction. Bearish trendlines are used to visualize and measure the price action during bearish tendencies on the chart.

In this manner, bearish trend lines are located above the price action and they connect the tops of the candles during downward moves. When the price is in a down run, it frequently bounces in a bearish direction from its bearish trendline.

When the price returns to its bearish trend line and bounces from it, we expect a further price decrease. However, if the price goes through the bearish trend in a bullish direction, we say the trend is broken upwards. In this manner, we expect the price to interrupt the bearish tendency and to reverse to the upside.

Let me now show you how a trend line acts on a chart:

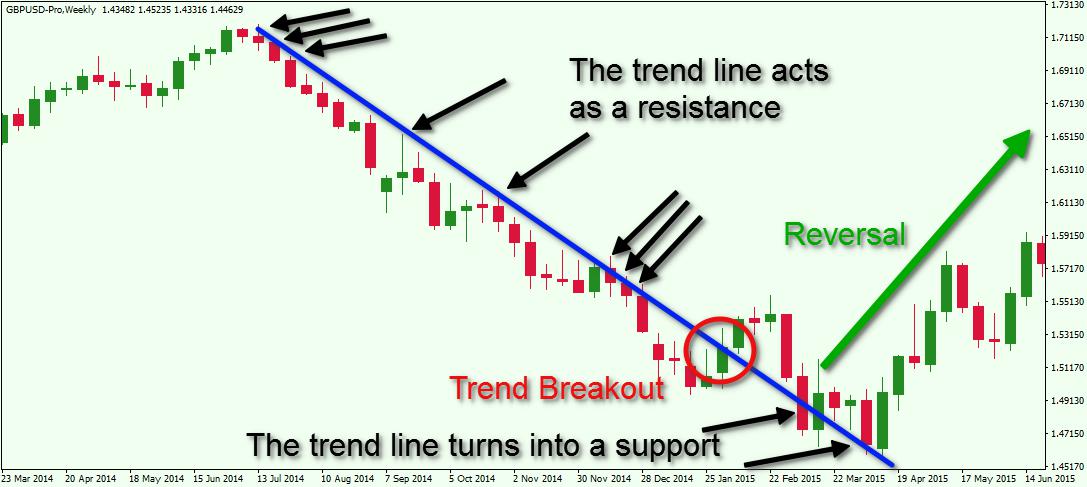
Forex-Technical-Analysis-Trend-Line.jpg


Above you see the weekly chart of the Cable (GBP/USD). The period it covers is Mar 2014 – Jun 2015. The image illustrates a bearish trend on a chart. The blue bearish line is the respective trend line of the downward price tendency. The black arrows on the chart point to the moments when the trend is being tested. The red circle on the chart shows the moment when the price creates a bullish breakout through the trend. The last two arrows at the end of the trend show the moment when the bearish trend turns from a resistance into a support. The green arrow indicates the reversal in the price direction after the breakout in the trend.

Forex Technical Analysis Indicators
Many technical traders use indicators in addition to horizontal and trend linesupport and resistance lines. There are two types of technical analysis indicators based on the timing of the signals they give. These are the lagging and the leading indicators. Let’s now discuss each of these types.

Lagging Indicators
Lagging indicators are also known as trend confirming indicators. The reason for this is that the signals of the lagging indicators come after the event has occurred on the chart. In this manner, the signal has a confirmation character.

The biggest benefit of Lagging indicators is that they provide relatively high success rate of signals. The negative though is that the lagging indicators put you in the trade fairly late. Because of this you will typically miss a relatively big part of the price move.

Some of the most popular lagging indicators are the Moving Averages (simple, exponential, volume weighted, displaced, etc.), Parabolic SAR and the Moving Average Convergence Divergence (MACD).

Leading Indicators
Leading indicators are typically the oscillator type. They are considered leading because these indicators give you a signal before the potential reversal has actually occurred on the chart. As such their signals tend to lead the events on the chart. The biggest benefits of leading indicators are that they can put you into a potential reversal early.


aff_i

However, the biggest negative of oscillators is that they can provide many false signals leading to a relatively lower success rate. This is why leading indicators are not good single standalone analysis tools for executing trades. Traders that utilize leading indicators should combine their analysis with other tools such as candlesticks and support and resistance when implementing their daily technical analysis in FX.

Some of the most widely used leading indicators are the Stochastic Oscillator, the Relative Strength Index, and the Momentum Indicator.

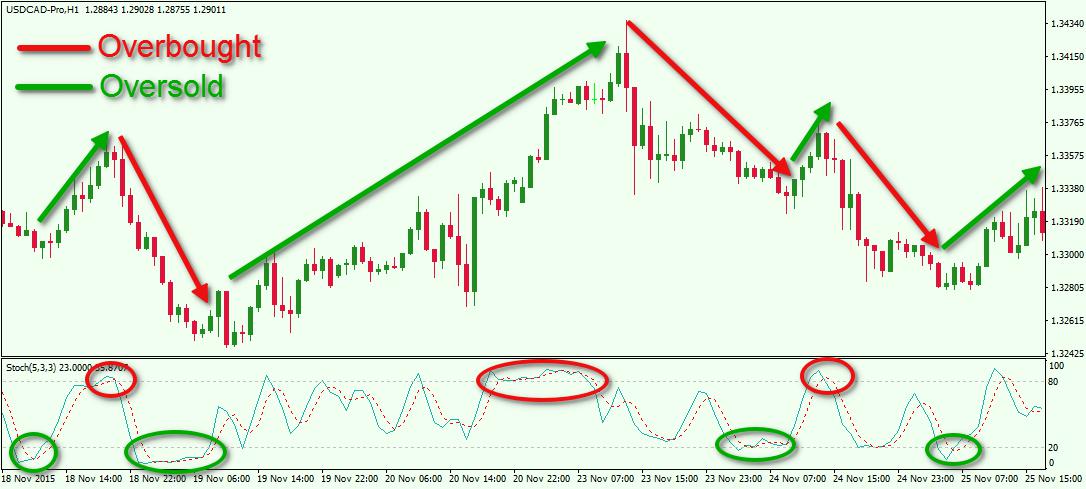
Now let me show you one of these indicators in action – the Stochastic Oscillator. The Stochastic gives two signals – overbought and oversold. In this manner, the indicator has three areas – an overbought area, an oversold area, and a middle area. When the indicator enters the oversold area we get a long signal. When the price enters the overbought area, we get a short signal. When the price is in the middle area, we get no signals.

Take a look at some of the signals that are provided by the Stochastic Oscillator:

Technical-Trading-with-the-Stochastic-Oscillator.jpg


This is the hourly chart of the USD/CAD Forex pair for Nov 18 – Nov 25, 2015. At the bottom of the chart we have attached the Stochastic Oscillator.

The red circles on the indicator show three overbought signals that led to price reversals. The green circles point out the valid oversold signals. Each signal has its adjoining arrow, which shows the move as a result of the signal. As you see there is a relation between the indicator signals and the price behavior. When the Stochastic enters the overbought area, a price decrease comes afterwards. When we see an oversold signal, we then see the price increasing.

Forex Price Action Trading
Pure Price Action trading is a subset of technical trading, which relies more on price and chart analysis than the use of trading indicators. Price action technical analysis in Forex is based on support, resistance, trend lines, chart patterns and candle patterns. Since we have already discussed supports, resistances and trend lines, lets now turn our attention to chart patterns and candlestick patterns.

Candlestick Patterns
Candle patterns are specific formations, which are created by individual or multiple candlesticks on the price chart. There are two main classifications of candle patterns – reversal candlestick formations, and continuation candlestick formations.

Reversal candle patterns are candlesticks, which tend to reverse the direction of the current price. Some of the more reliable reversal candlestick patterns are: hammer, shooting star, hanging man, engulfing, morning star, and evening star.

Continuation candle patterns are candlesticks, which tend to continue the price movement in the same direction. Some of more reliable continuation candle patterns are: mat hold, deliberation, method, and concealing baby swallow.

What is important to note is not the actual names of the candle patterns themselves, but the price action that they create. Once you are able to recognize the price movements that comprise the formations, you will be able to take advantage of trading them in an informed manner.

Classical Chart Patterns
Chart patterns are specific formations, which are created by the general price action on the chart. Same as the candle patterns, chart patterns are also classified in two types – reversal, and continuation.

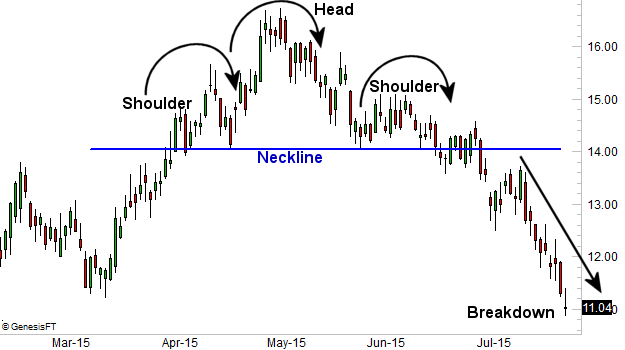
Reversal chart patterns are likely to be followed by reversal price movement on the chart. The most reliable reversal chart patterns in trading are: double top,double bottom, triple top, triple bottom, and head and shoulders.

Continuation chart patterns are used to predict the continuation of the general trend. The most popular among the continuation chart patterns are flags, triangles and rectangles.

The image below shows how price action based technical analysis works:

Forex-Price-Action-Trading.jpg


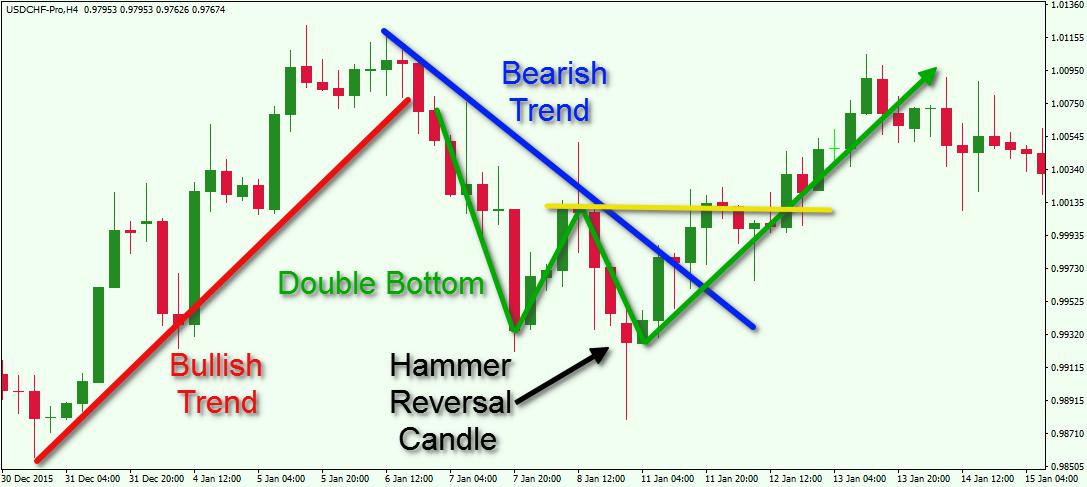
This is the H4 chart of the USD/CHF for Dec 30, 2015 – Jan 15, 2016. The image shows a few interesting on-chart events, which lead to potential trading opportunities.

The image starts with the price moving after a bullish trend line (red). Suddenly, the trend gets broken in a bearish direction, which creates a short breakout signal. The price starts to decrease afterwards. Two bottoms are created on the chart. The second one ends with a Hammer Reversal candlestick. As you see the price starts reversing to the upside shortly afterwards. On the way up the blue bearish trendline gets broken.

The two bottoms on the chart create the well known Double Bottom reversal chart pattern. The yellow resistance on the chart indicates the top between the two bottoms of the chart pattern. Therefore, the yellow resistance is the trigger line of the pattern. After the price action closes a candle above the yellow resistance, we expect a price increase equal to the size of the formation. So, the trend was bearish (blue line) and a Hammer candlestick, trendline breakout, and a Double Bottom chart pattern forecasted the reversal of the bearish movement.

Download the short printable PDF version summarizing the key points of this lesson….Click Here to Download
Conclusion
Technical Analysis in Forex relies on analyzing previous price behavior of currency pairs to determine potential price moves in the future.

The most important tools in technical analysis are:

  • Support Lines
  • Resistance Lines
  • Trend Lines: bullish and bearish
Other trading tools that currency technical analysts use are trading indicators. They are two types of trading indicators:

  • Leading Indicators: give the signal before the event has actually occurs on the chart
  • Lagging Indicators: gives the signals after the event has actually occurred
Pure Price Action analysts rely on technical analysis using price and chart analysis exclusively. Some of the common things that technical Price action traders utilize include:

  • Chart Patterns: reversal, and continuation
  • Candle Patterns: reversal, and continuation
  • Support and Resistance Lines
  • Trend Lines

Twitter 0Tweet !function(d,s,id){var js,fjs=d.getElementsByTagName(s)[0];if(!d.getElementById(id)){js=d.createElement(s);js.id=id;js.src="//platform.twitter.com/widgets.js";fjs.parentNode.insertBefore(js,fjs);}}(document,"script","twitter-wjs");" style="box-sizing: border-box; position: absolute; top: 12px; left: 16px; width: 105px; min-height: 15px; text-align: left; line-height: 15px; bottom: 10px;">Facebook 0Google+0 (function() { var po = document.createElement("script"); po.type = "text/javascript"; po.async = true; po.src = "https://apis.google.com/js/plusone.js"; var s = document.getElementsByTagName("script")[0]; s.parentNode.insertBefore(po, s); })(); " style="box-sizing: border-box; position: absolute; top: 12px; left: 16px; width: 105px; min-height: 15px; text-align: left; line-height: 15px; bottom: 10px;">


FEATURED CATEGORIES
Featured Categories
SEARCH


aff_i
 
Chart Patterns, Candlestick Pattern, Technical Analysis
space.gif

As with anything in life, education is a foundational building block of successful trading. But there is no holy grail out there. A "can't miss" strategy does not exist, but a general understanding of basic trading strategies is absolutely necessary.

Effectiveness of a particular strategy will depend on many factors. You will need to study them and pick the ones that fit your personality best. Then practice and experiment to see what works best for you.

In this section we discuss the 3-headed "technical" monster…chart patterns, candlestick patterns, and technical analysis. We also cover popular option strategies, and of course we offer our recommended reading on our bookshelf.


space.gif

Chart Patterns

Bullish Patterns
Symmetrical Triangles
Ascending Triangles
Rectangles
Pennants
Flags
Wedges
Head & Shoulder Bottom
Cup & Handle
Trendlines

Neutral Patterns
Symmetrial Triangles
Rectangles

Bearish Patterns
Symmetrical Triangles
Descending Triangles
Rectangles
Pennants
Flags
Wedges
Head & Shoulder Top
Trendlines

space.gif

Candlestick Patterns

Bullish Candles
Abandoned Baby
Belt Hold
Breakaway
Concealing Baby Swallow
Doji Star
Dragonfly Doji
Engulfing
Gravestone Doji
Hammer
Harami
Harami Cross
Homing Pigeon
Inverted Hammer
Kicking
Ladder Bottom
Mat Hold
Matching Low
Meeting Lines
Morning Doji Star
Morning Star
Piercing Line
Rising Three Methods
Separating Lines
Side by Side White Lines
Stick Sandwich
Three Inside Up
Three Line Strike
Three Outside Up
Three Stars In the South
Three While Soldiers
Tri Star
Unique Three River Bottom
Upside Gap Three Methods
Upside Tasuki Gap

Bearish Candles
Abandoned Baby
Advance Block
Belt Hold
Breakaway
Dark Cloud Cover
Deliberation
Downside Gap Three Methods
Downside Tasuki Gap
Doji Star
Dragonfly Doji
Engulfing
Evening Doji Star
Evening Star
Falling Three Methods
Gravestone Doji
Hanging Man
Harami
Harami Cross
Identical Three Crows
In Neck
Kicking
Meeting Lines
On Neck
Separating Lines
Shooting Star
Side By Side White Lines
Three Black Crows
Three Inside Down
Three Line Strike
Three Outside Down
Thrusting
Tri Star
Two Crows
Upside Gap Two Crows

space.gif

Technical Analysis

Technical Indicators
Accumulation/Distribution Line
ACX (Wilder's DMI)
Average True Range (ATR)
Bollinger Bands
Chaikin Money Flow (CMF)
Chaikin Oscillator
Commodity Channel Index (CCI)
Comparative Relative Strength
Donchian Channels
Exponential Moving Average
Keltner Channels
Linear Regression
MACD
MACD Histogram
Momentum
On Balance Volume (OBV)
Parabolic SAR
Price by Volume
Price Oscillator (PPO)
Rate of Change (ROC)
Relative Strength (RSI)
Simple Moving Average
Stochasti Oscillator
Volume
Volume Oscillator (PVO)
Williams %R

Breadth Indicators
Advance/Decline Line
Arms Index (TRIN)
Bullish Percent Index
McClellan Oscillator
McClellan Summation Index
New Highs/New Lows
Put/Call Ratio
VIX and VXO


space.gif


space.gif

HOME ABOUT ARCHIVES BLOG SUBSCRIBE SIGN IN

space.gif
Chart Patterns | Candlestick Patterns | Technical Analysis | Option Strategies | Bookshelf
space.gif

space.gif


Stock Exchange
OTC PINK, US
NASDAQ, US
LSE, UK
STOCKHOLM, Sweden
NSE, India
PARIS, France
BSE, India
XETRA, Germany
SZSE, China
AMEX, US
SET, Thailand
ASX, Australia
TSX, Canada
GTSM, Taiwan
HKEX, Hong Kong
SIX, Switzerland
IDX, Indonesia
KOSDAQ, South Korea
TOKYO, Japan
BORSA, Italy
BMV, Mexico
TSX-V, Canada
KSE, Pakistan
BIST, Turkey
NYSE, US
CSE, Canada
BOVESPA, Brazil
TASE, Israel
KRX, South Korea
GPW, Poland
Candlestick Pattern of the Day
DXB.axd

The chart above shows how GRBX rose following the detection of a BULLISH HARAMI CROSS pattern on 7/23/2018 and its subsequent confirmation on 7/24/2018. Gains based on this bullish pattern reached 139.29% since the day of confirmation, causing us to select BULLISH HARAMI CROSS as the pattern of the day for the OTC PINK Stock Exchange in US . Please, use the menu on the left, to see the pattern of the day for other stock markets.
 
MEMBERSHIP
LoginRegistrationMember Services
TOOLSStocksIndicesCandleQueryTop 25 ListsWatch List

EDUCATION
About CandlesticksCandlestick TermsIndicator Glossary
CONTACT US
HOME


Glossary of Candlestick Indicators
<Bullish> Click For Graphical Representations <Bearish>

Bullish Indicators

Bearish Indicators


Want to know more? Click here for references and deeper knowledge of Candlestick Patterns...


[Login] [Register] [Charts] [Top 25]
[CandleQuery] [Portfolio] [Guide] [Talk Shop] [Home]
 

Enter Symbol
Lookup Patterns
Popular tickers today...
AAPL AMD AMZNAUDUSD DIA EURUSDGDX HMHC INTCLIVE MU PVG SPY TWTRUSDCAD


As Seen In...


Enter Symbol
Lookup Patterns
Popular tickers today...
AAPL AMD AMZNAUDUSD DIA EURUSDGDX HMHC INTCLIVE MU PVG SPY TWTRUSDCAD

Enter Symbol
Lookup Patterns
Popular tickers today...
AAPL AMD AMZNAUDUSD DIA EURUSDGDX HMHC INTCLIVE MU PVG SPY TWTRUSDCAD


As Seen In...


About HotCandlestick.com

HotCandlestick.com was founded by a private investor in 2001 to identify candlestick chart patterns on a variety of time frames. Charting time frames include daily, weekly, monthly and quarterly.

Candlesticks can offer a glimmer into the psychology of short-term trading activity by showing whether the buyer or seller has control of the market. HotCandlestick.com is a candlestick pattern identification data service, not an investment advisory service.

Charts highlighting recent candlestick patterns are featured on the homepage. Click or tap here to search for stocks or currencies covered by HotCandlestick.com.

High and low prices are described as shadows and plotted as single lines.

candles.gif

The price range between the open and close is plotted as a rectangle on the single line. If the close is above the open, the body of the rectangle is white. If the close of the day is below the open, the body of the rectangle is red.

Candlestick pattern identifying factors include recent trend of the stock price, number of candlesticks in the pattern and daily volume. HotCandlestick.com maintains a continually updating database of patterns and their success rates over defined time intervals. Expect success rates to change over time based on different market cycles, major world events, etc.

Valid patterns are identified based on criteria such as daily volume and definitions of short and long individual candlesticks. Long and short candle body sizes are determined using a relative comparison of the previous 25 daily candle bodies on a stock by stock basis. This method of determining candle body size means that a non-volatile stock such as an ETF based on an index may have a long candle definition of 1.4% where a volatile stock may have a long candle definition of 8.7%.
Payment Options

Payment for a subscription to HotCandlestick.com: credit card, e-check or cash transfer from your bank account via PayPal. Make sure you create your HotCandlestick login first by filling out the signup form.

Click for payment options.

HotCandlestick Service ($18.00 / 30 days, $45.90 / 90 days, or $151.20 / year): Provides end of day daily, weekly, monthly and quarterly candlestick analysis of stocks traded on the United States exchanges. Index and sector ETFs and ETNs included. FOREX major currency pairs included. Searchable/sortable end of day historical data going back to 1992 - updated daily. View the benefits then signup for the HotCandlestick service.

If for any reason you are unsatisfied with the service within the first 30 days then use thecontact form to request a refund of your first subscription payment and we will issue the refund then cancel your subscription, no questions asked. Limit 1 refund per subscriber. An eligible refund is not automatically applied and must be requested within the 1st 30 days of the subscription. Refund is available only for your first payment.
Reference Material

As reference material this web site uses some of the basic concepts of candlestick charting found in books like Beyond Candlesticks: New Japanese Charting Techniques Revealed by Steve Nison and Candlestick Charting Explained: Timeless Techniques for Trading Stocks and Futures by Gregory L. Morris. Candlestick pattern strength and scores were created by HotCandlestick.com.

HotCandlestick.com, LLC is not affiliated in any way with Steve Nison or Greg Morris.
Next Page

» What is the origin and history of candlesticks?
Risk Statement

Any specific investment or investment service contained or referred to in this web site may not be suitable for all visitors to this site. An investment in stocks may mean investors may lose an amount even greater than their original investment. Anyone wishing to invest or speculate in the stock market should seek their own financial or professional advice. HotCandlestick.com, LLC is not an investment advisory service and does not recommend the purchase or sale of stocks. There are no licensed financial advisors working at HotCandlestick.com, LLC. HYPOTHETICAL PERFORMANCE RESULTS HAVE MANY INHERENT LIMITATIONS, SOME OF WHICH ARE DESCRIBED BELOW. NO REPRESENTATION IS BEING MADE THAT ANY ACCOUNT WILL OR IS LIKELY TO ACHIEVE PROFITS OR LOSSES SIMILAR TO THOSE SHOWN. IN FACT, THERE ARE FREQUENTLY SHARP DIFFERENCES BETWEEN HYPOTHETICAL PERFORMANCE RESULTS AND THE ACTUAL RESULTS SUBSEQUENTLY ACHIEVED BY ANY PARTICULAR TRADING SYSTEM. ONE OF THE LIMITATIONS OF HYPOTHETICAL PERFORMANCE RESULTS IS THAT THEY ARE GENERALLY PREPARED WITH THE BENEFIT OF HINDSIGHT. IN ADDITION, HYPOTHETICAL TRADING DOES NOT INVOLVE FINANCIAL RISK, AND NO HYPOTHETICAL TRADING RECORD CAN COMPLETELY ACCOUNT FOR THE IMPACT OF FINANCIAL RISK IN ACTUAL TRADING. FOR EXAMPLE, THE ABILITY TO WITHSTAND LOSSES OR TO ADHERE TO A PARTICULAR TRADING PROGRAM IN SPITE OF TRADING LOSSES ARE MATERIAL POINTS WHICH CAN ALSO ADVERSELY AFFECT ACTUAL TRADING RESULTS. THERE ARE NUMEROUS OTHER FACTORS RELATED TO THE MARKETS IN GENERAL OR TO THE IMPLEMENTATION OF ANY SPECIFIC TRADING PROGRAM WHICH CANNOT BE FULLY ACCOUNTED FOR IN THE PREPARATION OF HYPOTHETICAL PERFORMANCE RESULTS AND ALL OF WHICH CAN ADVERSELY AFFECT ACTUAL TRADING RESULTS. THE RISK OF LOSS IN TRADING STOCKS CAN BE SUBSTANTIAL. Stock trading is speculative and a substantial risk of loss exists. Past performance is not necessarily indicative of future results.


Ad Space
 
Capturing Profits Using Donchian Channel Breakouts


FOREX TRADING ARTICLES

Twitter 0Tweet !function(d,s,id){var js,fjs=d.getElementsByTagName(s)[0];if(!d.getElementById(id)){js=d.createElement(s);js.id=id;js.src="//platform.twitter.com/widgets.js";fjs.parentNode.insertBefore(js,fjs);}}(document,"script","twitter-wjs");" style="box-sizing: border-box; position: absolute; top: 12px; left: 16px; width: 105px; min-height: 15px; text-align: left; line-height: 15px; bottom: 10px;">Facebook 0Google+0 (function() { var po = document.createElement("script"); po.type = "text/javascript"; po.async = true; po.src = "https://apis.google.com/js/plusone.js"; var s = document.getElementsByTagName("script")[0]; s.parentNode.insertBefore(po, s); })(); " style="box-sizing: border-box; position: absolute; top: 12px; left: 16px; width: 105px; min-height: 15px; text-align: left; line-height: 15px; bottom: 10px;">
Breakout trading is a time tested strategy that has been used by some of the largest traders and hedge funds in the industry. There are a multitude of ways that a retail trader can incorporate a breakout style into their trading plan.

One of the oldest and simplest technical indicators used to trade breakouts is the Donchian Channel. In this lesson, we will learn the nuts and bolts of the Donchian Channel indicator, and then construct some trading strategies around it.

Download the short printable PDF version summarizing the key points of this lesson….Click Here to Download
Introduction to the Donchian Channel
The creator of the Donchian channel was a renown trader named Richard Donchian. During his trading career in the mid 1900’s, he was seeking ways to capture large price movements in the market and in fact, the Donchian channel technique is considered to be one of the earliest forms of trend following systems.

The Donchian indicator plots two primary lines which are based on the high and low price over a specified period of time. You can also add a middle line which is the average of the upper resistance line and the lower support line of the Donchian Channel. It is perhaps one of the simplest channel indicators to understand. Think of it as a simple N bar breakout.


Donchian analysis can be applied to any liquid market including forex, futures, and stocks. And it is versatile enough to trade across many different timeframes. The simplicity of this indicator contributes to its robustness across many different instruments and trading timeframes.

One of the earliest adopters of the Donchian technical trading concept were a famous group of traders called “The Turtles”. The Turtle trading strategy used two variations of the Donchian channel breakout- the 20 day breakout, and the 55 day breakout. Today, many traders that utilize the Donchian price channel tend to use the 20 period as the look back period.

You may be wondering if the Donchian channel is similar to the Bollinger band, since both tend to have a setting of 20 periods, and both are channel bands. Although they appear to be similar, they are quite different. Keep in mind that the Donchian channel indicator’s only variable input is the look back period. It does not take in a user input for volatility like the Bollinger Bands do.

That being said a trader can still gauge the volatility of a currency pair or financial instrument using the Donchian channel method. Generally, the wider the width of the Donchian channel, the more volatile the market, while the narrower the Donchian channel, the less volatile the market. Also, price action can pierce the Bollinger Bands, but you will not see that type of characteristic with the Donchian channel, as its bands are measuring the high and low of the specified period.

The Donchian channel is primarily a breakout type trend following indicator that provides two different types of breakout signals. We will be discussing this in more depth in the following sections.

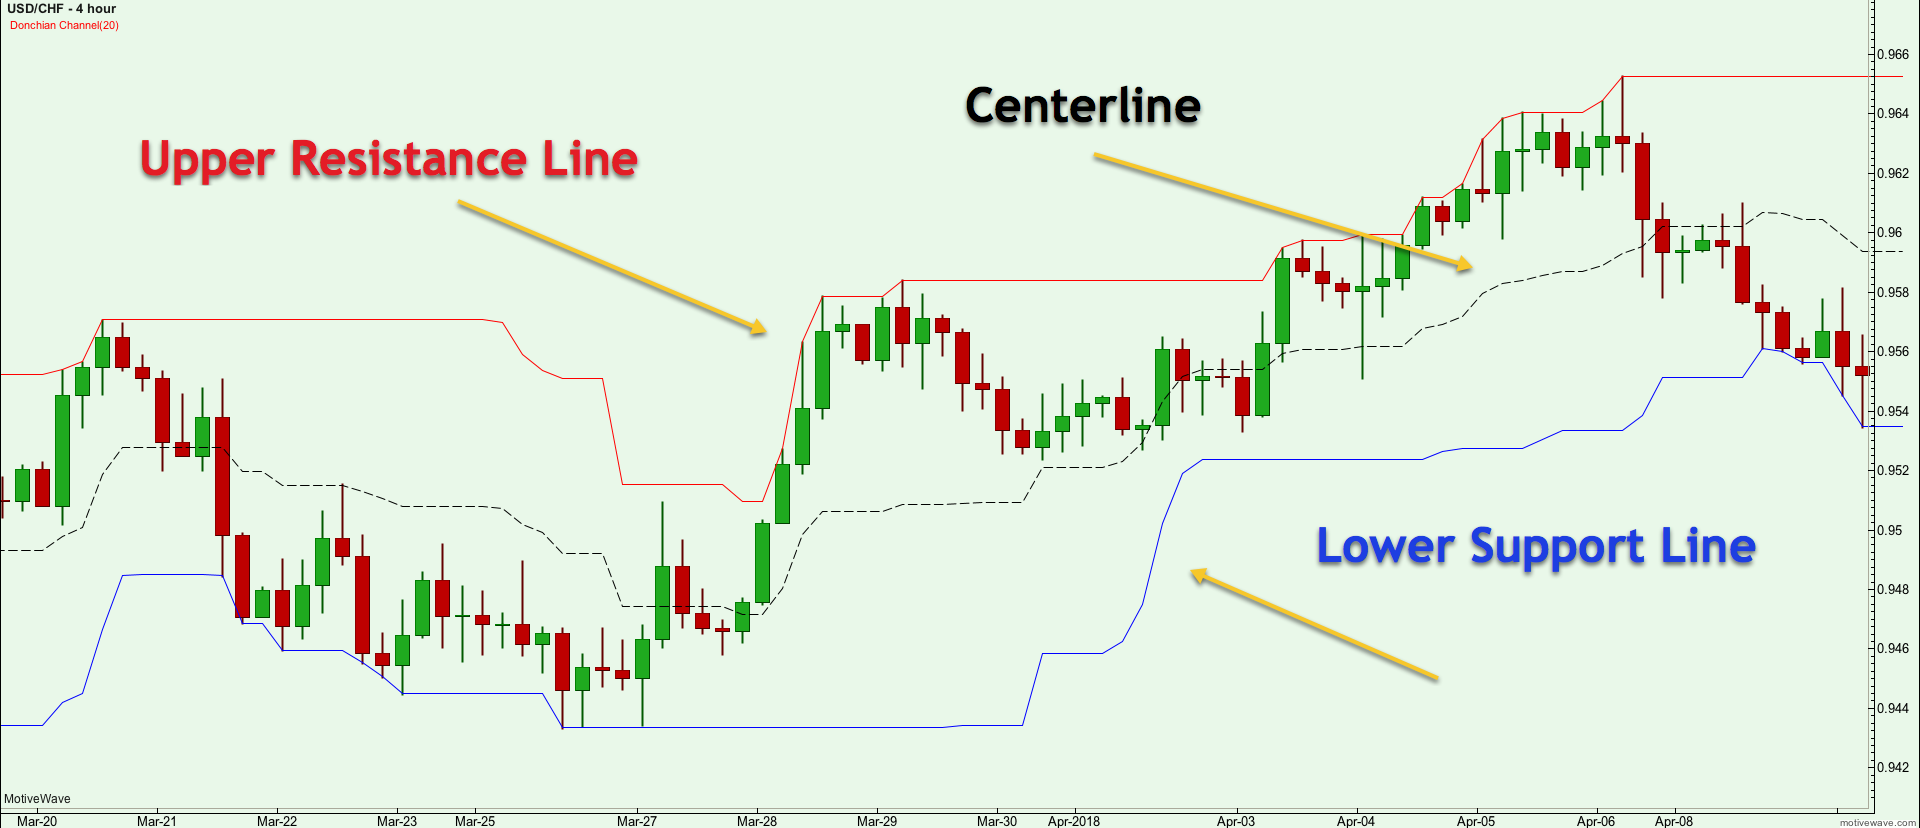
Take a look at the image below which shows the Donchian channel plotted on a price chart.

Donchian-Channel-Indicator.png


التقاط الأرباح باستخدام قناة Donchian Breakouts
تجارة الفوركس المقالات
Twitter 0Facebook 0Google + 0
تداول الكسر هو استراتيجية تم اختبارها من قبل والتي تم استخدامها من قبل بعض أكبر المتداولين وصناديق التحوط في هذه الصناعة. هناك العديد من الطرق التي يمكن لمتاجر التجزئة من خلالها دمج نمط الاختراق في خطة التداول الخاصة بهم.
واحدة من أقدم وأبسط المؤشرات الفنية المستخدمة للتجارب هي قناة Donchian. في هذا الدرس ، سنتعرف على المكسرات والمسامير الخاصة بمؤشر قناة Donchian ، ثم نقوم ببناء بعض استراتيجيات التداول حولها.
قم بتنزيل نسخة PDF القصيرة القابلة للطباعة التي تلخص النقاط الرئيسية في هذا الدرس ... انقر هنا للتنزيل
مقدمة لقناة Donchian
كان مبتكر قناة Donchian متداولًا معروفًا اسمه Richard Donchian. خلال مسيرته المهنية في منتصف القرن العشرين ، كان يبحث عن طرق لالتقاط تحركات الأسعار الكبيرة في السوق ، وفي الواقع ، تعتبر تقنية قناة Donchian واحدة من أقدم أشكال الاتجاه التالي للأنظمة.
يرسم مؤشر Donchian خطين أساسيين يعتمدان على السعر المرتفع والمنخفض خلال فترة زمنية محددة. يمكنك أيضًا إضافة خط متوسط يمثل متوسط خط المقاومة العلوي وخط الدعم السفلي لقناة Donchian. ربما يكون واحدًا من أبسط مؤشرات القنوات التي يجب فهمها. التفكير في الأمر على أنه اختراق بسيط N بار.
يمكن تطبيق التحليل Donchian على أي سوق السائل بما في ذلك الفوركس والعقود الآجلة والأسهم. وهو متعدد الجوانب بما فيه الكفاية للتداول عبر العديد من الأطر الزمنية المختلفة. تساهم بساطة هذا المؤشر في متانته عبر العديد من الأدوات المختلفة والأطر الزمنية التجارية.
كان واحدا من أوائل المتبنين لمفهوم التجارة التقنية Donchian مجموعة مشهورة من التجار تسمى "السلاحف". استخدمت استراتيجية التداول السلحفاة اثنين من الاختلافات في اختراق قناة Donchian - الاختراق لمدة 20 يومًا ، واختراق 55 يومًا. واليوم ، يميل العديد من المتداولين الذين يستخدمون قناة سعر Donchian إلى استخدام الفترة العشرين كفترة مراجعة.
قد تتسائل إذا كانت قناة Donchian مشابهة لفرقة بولينجر ، لأن كلاهما يميلان إلى إعداد 20 فترة ، وكلاهما نطاقا قناة. على الرغم من أنها تبدو متشابهة ، إلا أنها مختلفة تمامًا. ضع في اعتبارك أن الإدخال المتغير الوحيد الخاص بمؤشر قناة Donchian هو فترة البحث السابقة. لا يأخذ في مدخلات المستخدم لتقلب مثل القيام Bollinger Bands.
ومع ذلك ، يمكن للمتداول أن يقيس مدى تقلب زوج العملات أو الأداة المالية باستخدام طريقة قناة Donchian. بشكل عام ، كلما كان عرض قناة Donchian أوسع ، كلما كان السوق أكثر تقلبًا ، بينما كانت القناة Donchian أضيق ، أقل تقلبًا في السوق. أيضا ، يمكن لحركة السعر أن تخترق البولنجر باند ، لكنك لن ترى هذا النوع من الخاصية مع قناة Donchian ، حيث أن فرقها تقيس أعلى وأدنى فترة محددة.
القناة Donchian هي في المقام الأول اتجاه نوع الاختراق التالي مؤشر يوفر نوعين مختلفين من إشارات الكسر. سنناقش هذا بتعمق أكبر في الأقسام التالية.
إلقاء نظرة على الصورة أدناه والتي تظهر قناة Donchian رسمت على الرسم البياني للسعر.

Donchian-Channel-Indicator.png


================


You will notice there are three lines that comprise the Donchian Channel – the Upper Resistance Line, the Lower Support Line and the Centerline.

How to Calculate Donchian Channels
As we have touched on earlier, the Donchian Channel only requires the look back period for the input. The indicator then takes the user defined look back period and calculates the upper resistance line and the lower support line. These two lines are then plotted on the price chart. As an option, a trader can add a third line, the centerline. The centerline is calculated and plotted as the average of the upper and lower band. Generally, the default value of the look back is 20 periods.

So, to summarize the Donchian Indictor calculation:

Upper Line of Donchian – Highest price for the last N bars.


Lower Line of Donchian – Lowest price for the last N bars.

Centerline – (N period High + N period Low) / 2

For example, let’s assume we are looking at the hourly chart of the EURUSD currency pair and were using a look back of 20 periods for our Donchian indicator setting. Say that the 20 hour high was 1.3210 and the 20 hour low was 1.3150. Based on this, the Donchian indicator would plot an upper resistance line at 1.3210 and a lower support line at 1.3150. The centerline would be drawn at 1.3180.

As you can see, the Donchian indicator is very straight forward and easy to comprehend. But as simple as it is, you should not underestimate its effectiveness in finding good trading opportunities in the market.

Donchian Channel Signals
The Donchian Channel is typically used as a breakout indicator. There are essentially two main types of breakout signals that the Donchian Band provides. One is the break of the Upper Resistance line or the Lower Support line. The second type of breakout signal that you can utilize is the Centerline cross. The Donchian channel strategy was primarily created to take advantage of potential trends, so when you enter the market using any of these two breakout signals, you can be sure that you will catch almost every emerging trend in the currency pair.

Learn What Works and What Doesn’t In the Forex Markets….Join My Free Newsletter Packed with Actionable Tips and Strategies To Get Your Trading Profitable…..Click Here to Join
Donchian Band S/R Breakout Signal
Trend traders typically enter in the direction of a breakout expecting a strong follow through which would lead to a trending price move. Using the Donchian Band, a buy signal occurs when prices hit the upper band, and a sell signal occurs when prices hit the lower band.

You should keep in mind that the Donchian channel reprints on the chart and as such you need to keep a careful eye out so that you can act quickly when the price has breached a Donchian S/R level. If your charting software allows it, it would be best to set price alerts so that you do not miss the breakout opportunity.

Some traders prefer to enter every breakout, while other traders prefer only to trade breakouts that occur on high volume or high momentum. The reason for this is that there is a higher likelihood of price follow-through if the breakout occurs on high volume and/or with high momentum. Essentially, it would be confirming that there is some real strength behind the breakout that would help propel prices in the direction of the breakout. Filtering trades based on high volume or momentum will lead to less whipsawing and higher win rates, however, the downside is that you may miss some strong moves due to the additional filtering process.

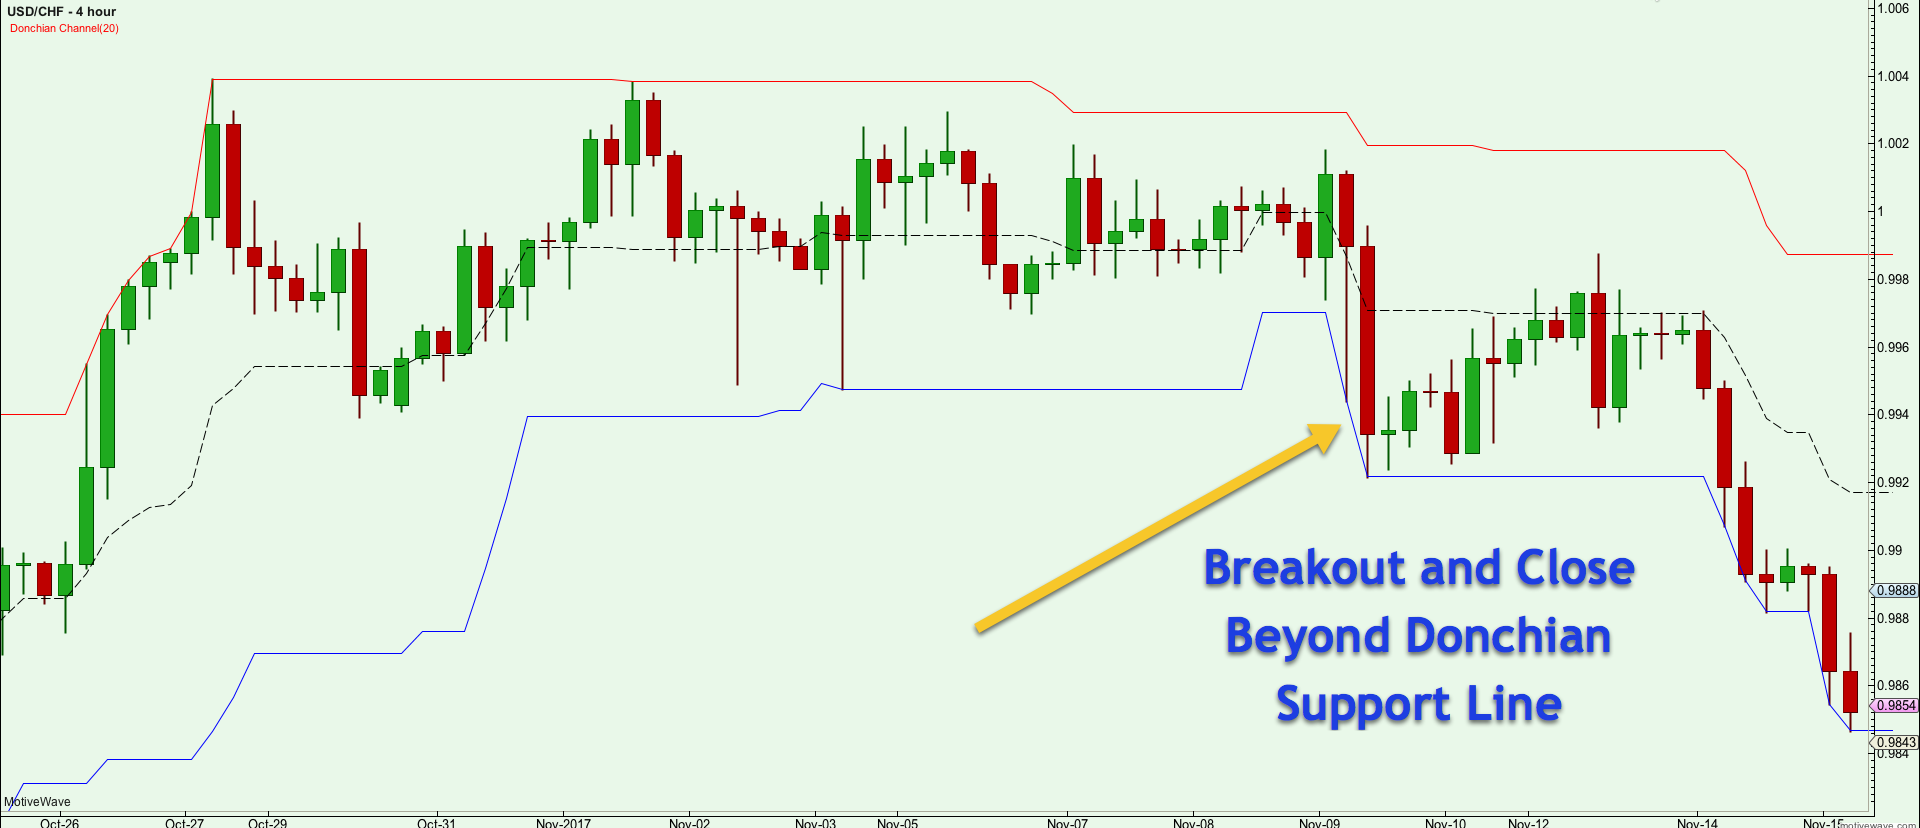
You will have to decide which method is more suitable for your temperament. When trading the FX markets, where volume data is not readily available, you may want to use a momentum based filter such as RSI or MACD. When trading currencies in the futures market, where volume data is available, you can consider either filtering with Volume or Momentum. Let’s take a look at an example below that shows the Donchian Channel S/R breakout signal on the price chart.

Donchian-Channel-Breakout-Signal.png


Notice on the chart that prices were trading in a range, and then there was a breakout bar that closed below the lower Donchian channel line. This would be considered a Donchian support line breakout.


ستلاحظ أن هناك ثلاثة أسطر تتألف من قناة Donchian - خط المقاومة العلوي وخط الدعم الأدنى و خط Centerline.
كيفية حساب القنوات Donchian
كما لمسنا في وقت سابق ، لا تتطلب قناة Donchian سوى فترة البحث عن المدخلات. ثم يأخذ المؤشر فترة البحث المحددة من قبل المستخدم ويحسب خط المقاومة العلوي وخط الدعم السفلي. ثم يتم رسم هذين الخطين على الرسم البياني للسعر. كخيار ، يمكن للمتداول إضافة سطر ثالث ، الخط المركزي. يتم حساب الخط الأوسط وتخطيطه كمتوسط النطاق العلوي والسفلي. بشكل عام ، القيمة الافتراضية للنظرة مرة أخرى هي 20 نقطة.
إذن ، لتلخيص حساب مؤشر Donchian Indictor:
الخط الأعلى من Donchian - أعلى سعر لأشرطة N الأخيرة.
أدنى خط Donchian - أدنى سعر لأخر N البارات.
Centerline - (N الفترة العليا + N فترة منخفضة) / 2
على سبيل المثال، لنفترض أننا نبحث في الرسم البياني للساعة لزوج اليورو مقابل الدولار الأميركي عملة وكانوا يستخدمون ظهر نظرة من 20 فترات لوضع مؤشر Donchian لدينا. لنفترض أن قمة 20 ساعة كانت 1.3210 وكان أدنى سعر ليوم 20 هو 1.3150. بناءً على ذلك ، سيؤشر مؤشر Donchian خط المقاومة العلوي عند 1.3210 وخط الدعم السفلي عند 1.3150. سيتم رسم خط الوسط عند 1.3180.
كما ترون ، فإن مؤشر Donchian بسيط للغاية ويسهل فهمه. ولكن بكل بساطة ، لا ينبغي عليك التقليل من فعاليتها في العثور على فرص تداول جيدة في السوق.
إشارات قناة Donchian
تستخدم قناة Donchian عادة كمؤشر للكسر. هناك أساسا نوعان رئيسيان من إشارات الاختراق التي تقدمها فرقة Donchian. أحدهما هو كسر خط المقاومة العلوي أو خط الدعم السفلي. النوع الثاني من إشارة الاختراق التي يمكنك استخدامها هو Crossline cross. تم إنشاء استراتيجية قناة Donchian في الأساس للاستفادة من الاتجاهات المحتملة ، لذلك عندما تدخل السوق باستخدام أي من هذين الإشارات المنفصلة ، يمكنك أن تكون على يقين من أنك سوف تصادف كل اتجاه صعودي تقريبًا في زوج العملات.
تعلم ما يعمل وماذا لا في أسواق الفوركس ... انضم إلى نشرة أخباري المجانية معبأة مع نصائح وإستراتيجيات عملية للحصول على تجارة مربحة… ..انقر هنا للتسجيل
فرقة Donchian باند S / R اندلاع
يدخل متداولو الاتجاه عادة في اتجاه الاختراق ويتوقعون متابعة قوية من خلالها قد تؤدي إلى تحرك السعر الشائع. وباستخدام النطاق Donchian ، تحدث إشارة الشراء عندما تصل الأسعار إلى النطاق الأعلى ، وتحدث إشارة بيع عندما تصل الأسعار إلى النطاق الأدنى.
يجب أن تضع في اعتبارك أن القناة Donchian تطبع على الرسم البياني وعلى هذا النحو تحتاج إلى أن تراقب بعناية بحيث يمكنك التصرف بسرعة عندما يكون السعر قد اخترق مستوى S / R Donchian. إذا كان برنامج الرسم يسمح بذلك ، فمن الأفضل تحديد تنبيهات الأسعار حتى لا تفوت فرصة الاختراق.
يفضل بعض المتداولين الدخول في كل اختراق ، في حين يفضل المتداولون الآخرون فقط الاختراق التجاري الذي يحدث على مستوى مرتفع أو زخم عالي. والسبب في ذلك هو أن هناك احتمالية أعلى لمتابعة السعر إذا حدث الاختراق على مستوى مرتفع و / أو مع زخم عالي. وبشكل جوهري ، سيكون التأكيد على أن هناك بعض القوة الحقيقية وراء الكسر الذي من شأنه أن يساعد على دفع الأسعار في اتجاه الاختراق. ستؤدي تصفية التداولات على أساس الحجم المرتفع أو الزخم إلى انخفاض معدلات الارتفاع ومعدلات الفوز الأعلى ، ومع ذلك ، فإن الجانب السلبي هو أنك قد تفقد بعض التحركات القوية بسبب عملية التصفية الإضافية.
سيكون عليك أن تقرر الطريقة الأكثر ملاءمة لمزاجك. عند التداول في أسواق العملات الأجنبية ، حيث لا تتوفر بيانات حجم التداول بسهولة ، قد ترغب في استخدام مرشح قائم على الزخم مثل RSI أو MACD. عند تداول العملات في سوق العقود الآجلة ، حيث تتوفر بيانات حجم التداول ، يمكنك النظر في أي من التصفية باستخدام Volume أو Momentum. دعنا نلقي نظرة على مثال أدناه يوضح إشارة اختراق قناة دونيشي S / R على الرسم البياني للسعر.
Donchian قناة-اندلاع الإشارات

Donchian-Channel-Breakout-Signal.png

لاحظ على الرسم البياني أن الأسعار كانت تتداول في نطاق ، ومن ثم كان هناك شريط الاختراق الذي أغلق أسفل خط قناة Donchian السفلي. هذا يعتبر بمثابة كسر خط دعم Donchian.


imp.php


Donchian Centerline Breakout Signal
As we have touched on earlier, the Donchian channel is comprised of two primary lines, the upper resistance line and the lower support line. The user has the option to add an additional third line. This is the centerline, and is the average of the upper and lower line.

The centerline has several useful applications. Firstly, it can be used as a breakout signal to enter a new position. When prices cross over the centerline to the upside, you could buy and when prices cross the centerline to the downside, then you could sell. Aggressive traders would enter at the centerline to initiate a new position rather than wait for the S/R line to be breached.

In addition to using the centerline to get into a new position, traders can also utilize the centerline as a means of adding to positions. Usually this type of scenario plays out after a minor retracement within a trend is followed by a resumption of price in the direction of the prevailing trend. This allows a trader to add positions as price is moving in the intended direction.

Another useful way to incorporate the Donchian centerline is use it as an exit strategy. So, if you are in a long trade, you would wait for prices to cross below the Donchian centerline and then you would exit the trade and vice versa for a short position. This method will allow you to capture a large portion of a trend move while keeping your open profit protected against a significant adverse price move.

It is an excellent way to protect your profits and keeps the trader disciplined in their trade management. It will help you to stay with the trend and avoid getting out too early. At the same time, it will help you to lock in profits when you are feeling overconfident in your winning position.

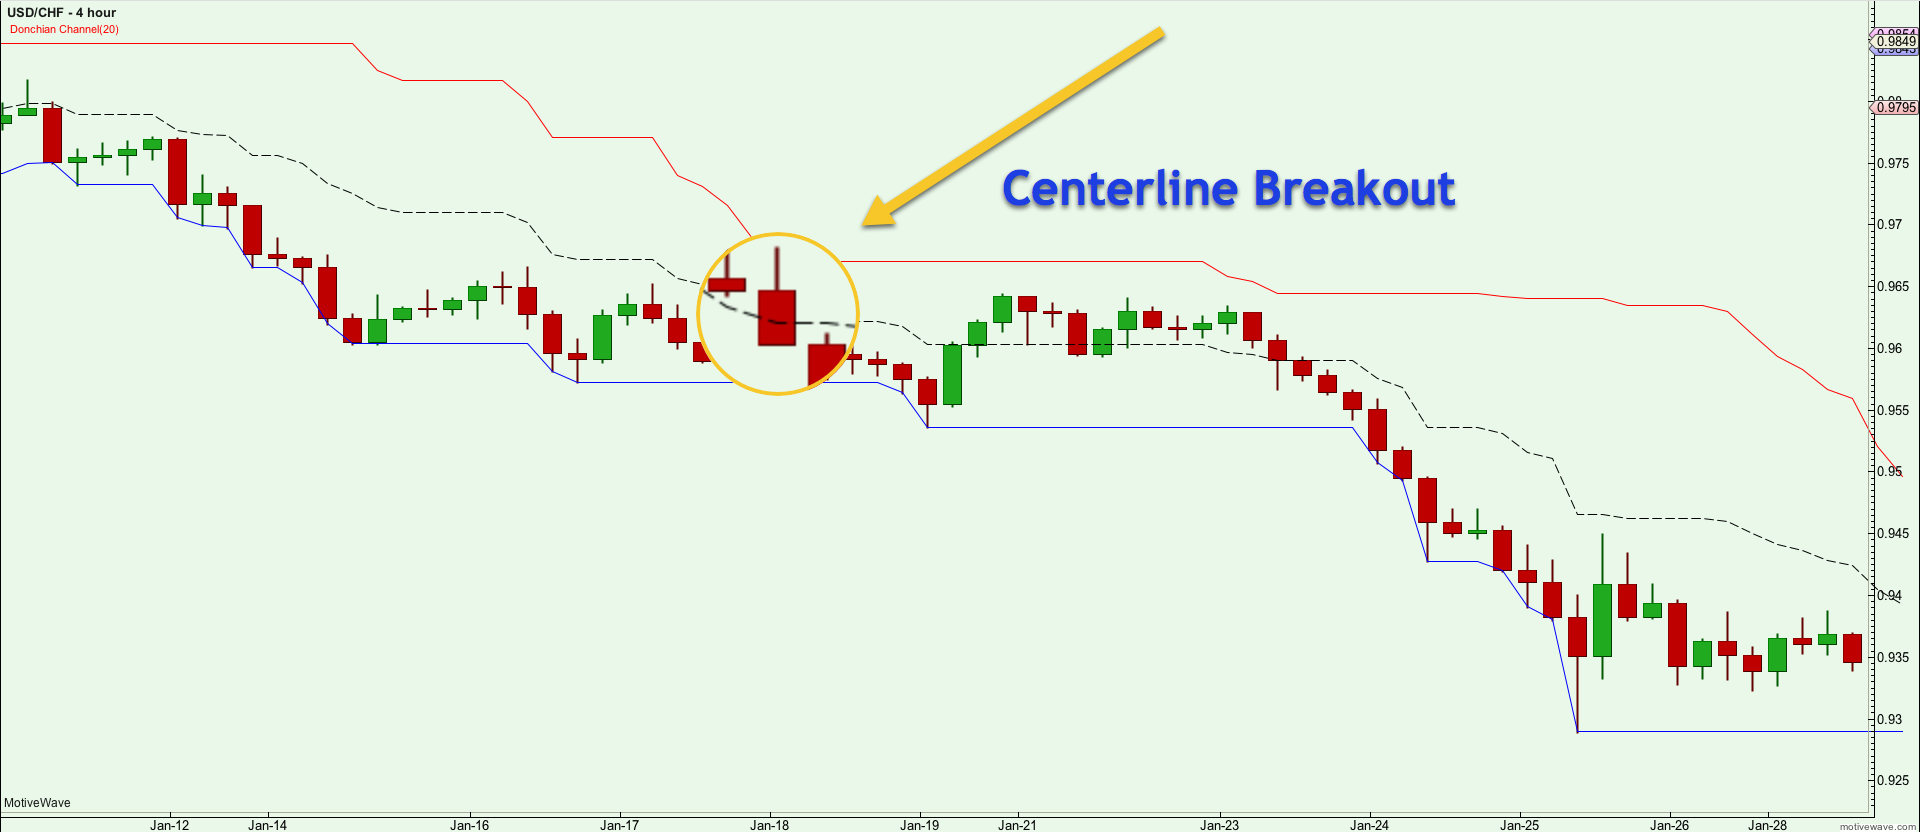
Let’s take a look at the Donchian Centerline Breakout:

Donchian-Centerline-Breakout.png


The price action has been trending downward and then retraced to the upside, crossing the Donchian centerline. Then price quickly fell and closed below the centerline. The breakout bar has been magnified on the chart. This is considered a Donchian Centerline Breakout signal.


Donchian Centerline Breakout Signal
كما لمسنا في وقت سابق ، تتألف قناة Donchian من خطين رئيسيين ، خط المقاومة العلوي وخط الدعم السفلي. المستخدم لديه خيار لإضافة سطر ثالث إضافي. هذا هو الخط المركزي ، وهو متوسط الخط العلوي والسفلي.
يحتوي الخط المركزي على العديد من التطبيقات المفيدة. أولاً ، يمكن استخدامه كإشارة اندلاع لدخول موضع جديد. عندما تتقاطع الأسعار فوق خط الوسط إلى الأعلى ، يمكنك أن تشتري ، وعندما تتقاطع الأسعار مع خط الوسط إلى الجانب السفلي ، عندها يمكنك البيع. يدخل التجار المغامرين عند خط الوسط لبدء مركز جديد بدلاً من الانتظار حتى يتم اختراق خط S / R.
بالإضافة إلى استخدام خط الوسط للدخول إلى مركز جديد ، يمكن للمتداولين أيضًا استخدام خط الوسط كوسيلة للإضافة إلى الوظائف. عادة ما يحدث هذا النوع من السيناريو بعد ارتداد صعودي في الاتجاه يتبعه استئناف السعر في اتجاه الاتجاه السائد. يسمح هذا للمتاجر بإضافة المراكز حيث يتحرك السعر في الاتجاه المقصود.
طريقة أخرى مفيدة لدمج الخط المركزي Donchian هو استخدامه كإستراتيجية خروج. لذلك ، إذا كنت في صفقة تداول طويلة ، فإنك تنتظر أن تتخطى الأسعار دون خط الوسط في Donchian ومن ثم تخرج من الصفقة والعكس صحيح لصفقة بيع. ستسمح لك هذه الطريقة بالتقاط جزء كبير من حركة الاتجاه مع الحفاظ على ربحك المفتوح محمي ضد حركة سعر سلبي كبير.
إنها طريقة ممتازة لحماية أرباحك وتحافظ على انضباط التاجر في إدارة تجارته. وسوف تساعدك على البقاء مع هذا الاتجاه وتجنب الخروج في وقت مبكر جدا. في الوقت نفسه ، سوف يساعدك ذلك على جني الأرباح عندما تشعر بالثقة الزائدة في مركزك الرابح.
دعنا نلقي نظرة على لعبة Donchian Centerline Breakout:

Donchian-Centerline-Breakout.png

Donchian-يشطر-اندلاع
كانت حركة السعر تتجه نحو الانخفاض ثم أعيدت صعودها في الاتجاه الصعودي متجاوزةً خط الوسط في Donchian. ثم انخفض السعر بسرعة وأغلق تحت خط الوسط. تم تضخيم شريط الاختراق على الرسم البياني. هذا يعتبر إشارة اندلاين سنترلين Breakout.

Donchian Channel Trading Strategies
By now you should have a good understanding of Donchian bands, and it relevance to trend trading. Now we will dig a little deeper and construct a fewtrading strategies using the Donchian channel in forex. These strategies should provide some insights on how to best trade with the Donchian indicator, and should inspire you to come up with some unique ideas of your own that you canrun a backtest for and validate.

Donchian Centerline with 200 Period SMA
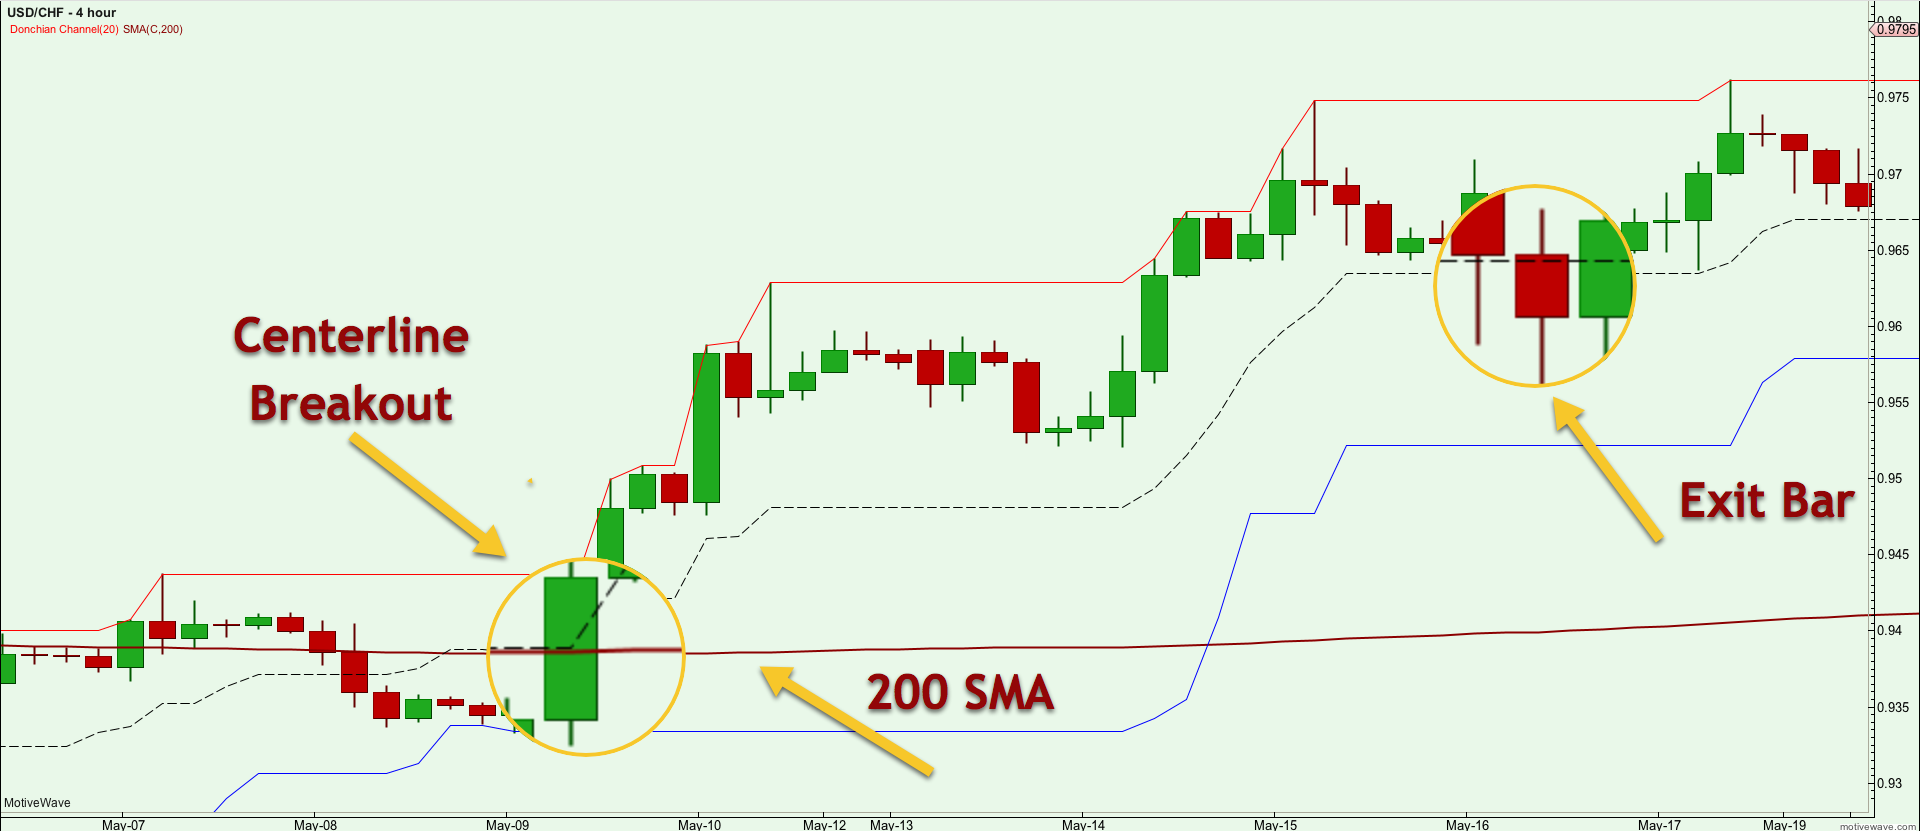
The first strategy that we will describe combines the Donchian centerline with the 200 Period SMA ( Simple Moving Average). The idea behind this trading system is to try to capture moves in the direction of the longer term trend. The 200 SMA is used to indicate the longer term directional bias on the trade.

So, if price is currently below the 200 period SMA, we will only be looking to take short trades. And similarly, if price is currently above the 200 period SMA, we will only be looking to take long trades. This will help keep us on the right side of the market for the most part.


aff_i

Our trade entry signal will be based on the Donchian centerline. Assuming that the 200 Period SMA filter has been met, a long trade will be initiated when price crosses and closes above the 20 Period Donchian Centerline.

And on the flip side, assuming that the 200 period SMA filter has been met, a short trade will be initiated when price crosses and closes below the 20 Period Donchian Centerline. This is a simple, yet robust entry technique.

Now for the stop loss placement, we will place a stop at the most recent swing just before the Donchian centerline cross. And for the take profit target, we will close and exit the trade when prices cross over the Donchian centerline in the opposite direction.

Let’s now turn our attention to the currency price chart below which illustrates this strategy in more detail:

Donchian-Trading-Strategy-1.png


Above is the 4 hour chart of the USDCHF currency pair. Prices were trading in a tight consolidation range around the 200 Period SMA. Then there was a strong upside bar that broke through the Centerline. The same bar also closed above the 200 SMA. This breakout bar has been noted and magnified on the chart. So, the signal to enter would occur at the close of this bar. Our stop would be placed just below this bar.

From there prices quickly moved higher. Six bars after the entry signal, a shooting star pattern appeared on the chart. which would have warned us that an impending price decline was possible. Afterwards, prices started to consolidate a bit but then moved higher breaking above the shooting star formation. Shortly thereafter, a second shooting star pattern appeared, which would again be a warning that a retracement or reversal was likely imminent. Price started to fall after this second shooting star pattern was seen. Eventually price crossed the Donchian centerline and closed below it. You can see the Exit Bar has been noted and magnified on the chart. This would have served as our exit signal on the trade.

Donchian Bollinger Band Squeeze
This next setup that we will discuss is one that I really like and refer to often in low volatility environments. It is called the Donchian Bollinger Band Squeeze strategy. This setup combines the Donchian Channel and the Bollinger Bands. It is a great combination to find low volatility markets where prices are likely to breakout soon. The logic behind this Donchian trading system lyes in the premise that markets are cyclical by nature. There will be periods of low volatility followed by high volatility and back again. This is how the market breathes and is the natural ebb and flow of most currency pairs and other financial instruments.

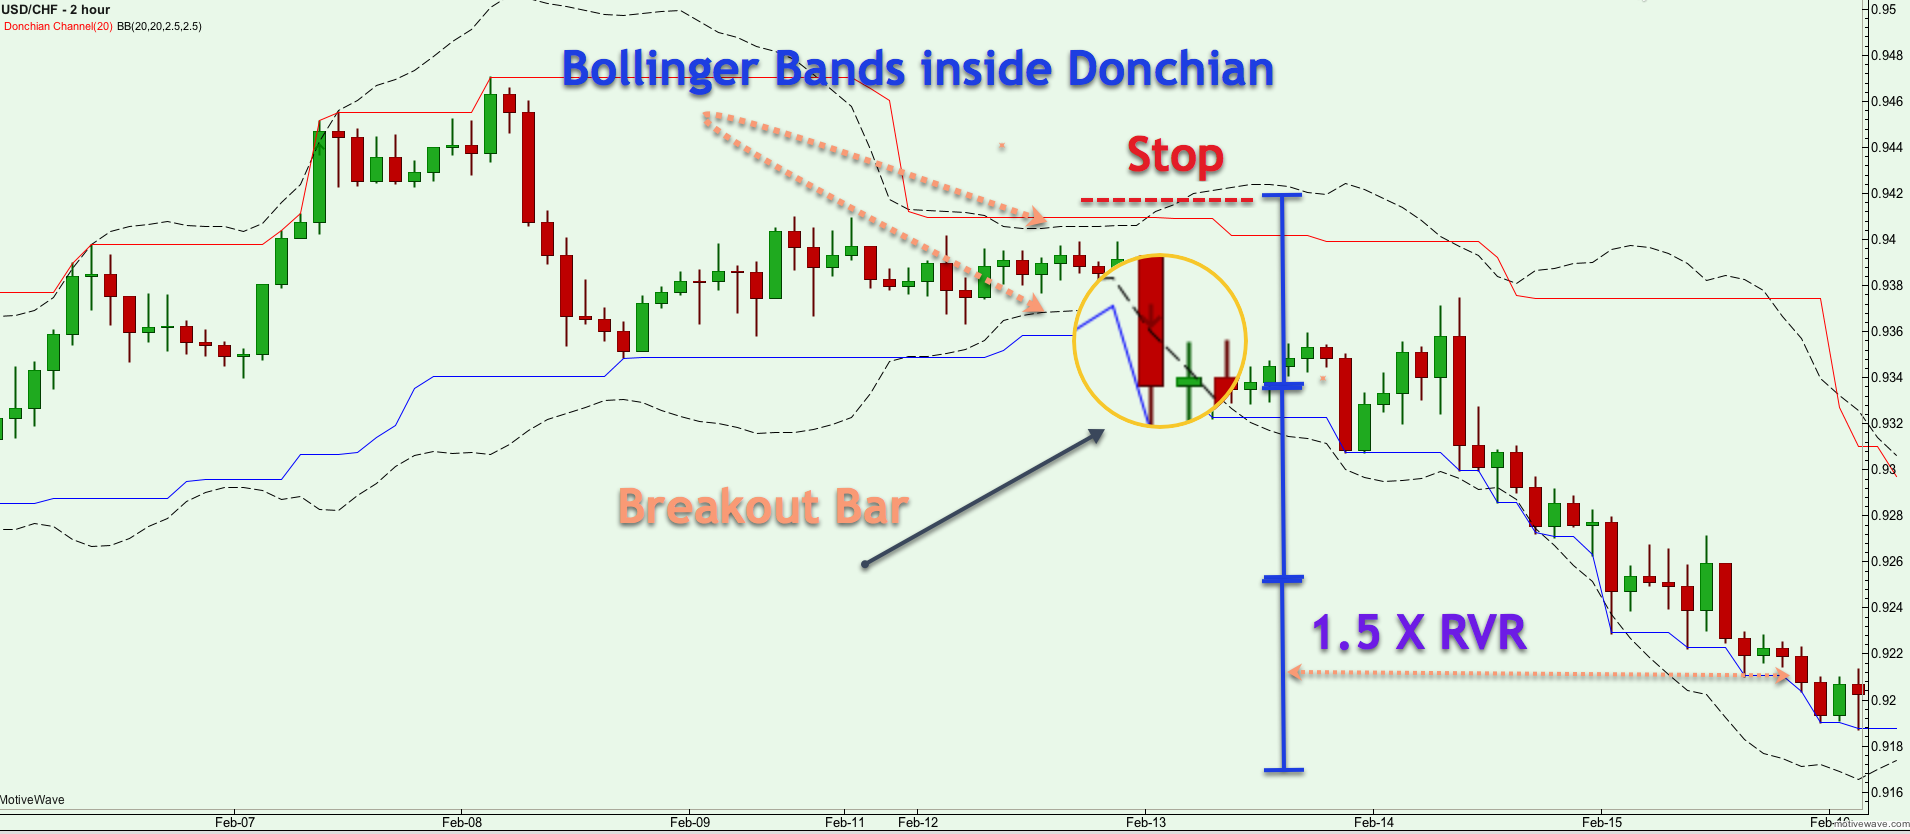
The setup occurs when both the Upper and Lower Bollinger band lines are contained within the Donchian Channel. The setting used for the Donchian bands is the default 20 period look back. And for the Bollinger Bands, we will also use the default setting of 20 periods, however for that standard deviation, we will use 2.5 rather that 2. This tends to work better in locating lower volatility conditions that are poised to make a move.

The entry signal will be based on the Donchian Upper and Lower lines. So, the trading system will look to enter long when the Bollinger bands have been recently contained within the Donchian Channel and price breaks and closes above the upper resistance of the Donchian band. And conversely, the trading system will look to enter short when the Bollinger bands have been recently contained within the Donchian Channel and price breaks and closes below the lower support of the Donchian band. It is important to keep in mind that the Bollinger bands do not necessarily need to be within the Donchian channel at the time of the breakout.

For the stop loss placement, we will put in the stop at the most recent swing just before the breakout. And for the take profit target, we will close and exit the trade based on a 1.5 : 1 RVR (reward to risk ratio).

You can refer to the trading example below which details the Donchian Bollinger Band Squeeze setup:

Donchian-Channel-System-2.png


In the above chart, we have the price action for the USDCHF pair using the 240 minute timeframe. Starting with the left side of the chart, we can see that prices were heading higher and made three minor tops prior to a swift price drop. After the price decline, prices began to consolidate and trade in a tight narrow range for several days. Towards the latter part of this low volatility market condition, the Bollinger Bands entered inside the Donchian channel.

This scenario confirms the trade setup, and we would be preparing for a breakout of either the lower Donchian support line or the upper Donchian resistance line. In this case, prices broke to the downside with a high momentum bar that closed beyond the Donchian Support line. The breakout bar that serves as the entry signal has been noted on the chart.

The stop loss would be place above the recent swing level and the upper wicks within the consolidation range. After the entry, prices traded sideways for a few days before moving sharply lower and hitting our take profit target. The take profit target, which is based on the 1:5 : 1 Reward to Risk ratio has been marked on the chart.

Download the short printable PDF version summarizing the key points of this lesson….Click Here to Download
Conclusion
As we have learned in this article, Donchian channels are a simple yet effective tool for trading breakouts. The general principles behind the indicator have been an inspiration to many traders around the world, particularly to trend following system traders. In fact, many of the greatest traders in the world including the famous “Turtles” used a variation of the Donchian channel to build their trend following system models.

The true power of the Donchian indicator is realized when you are able to combine it with other technical studies such as Moving Averages, Momentum, or Bollinger Bands to create a robust trading methodology. Now it’s your turn to take what you have learned and start applying it in the markets or even better to start building upon these concepts to improve on the ideas presented so that you can carve out your own variation of a Donchian channel trading system.


استراتيجيات التداول قناة Donchian
الآن يجب أن يكون لديك فهم جيد لشرائح Donchian ، وأنها ذات الصلة لتداول الاتجاه. الآن سوف نحفر أعمق قليلاً ونبني بعض استراتيجيات التداول باستخدام قناة Donchian في الفوركس. يجب أن تقدم هذه الاستراتيجيات بعض الأفكار حول أفضل طريقة للتداول مع مؤشر Donchian ، ويجب أن تلهمك للتوصل إلى بعض الأفكار الفريدة الخاصة بك والتي يمكنك من خلالها إجراء اختبار رجعي وإجراء التحقق.
Donchian Centerline مع 200 فترة SMA
الاستراتيجية الأولى التي سنصفها تجمع بين خط Donchian المركزي وبين المتوسط المتحرك البسيط لـ 200 فترة (المتوسط المتحرك البسيط). الفكرة وراء نظام التداول هذا هو محاولة التقاط التحركات في اتجاه الاتجاه طويل الأمد. يتم استخدام المتوسط المتحرك البسيط 200 للإشارة إلى التحيز الاتجاهي على المدى الطويل في الصفقة.
وبالتالي ، إذا كان السعر حاليًا أدنى SMA 200 فترة ، فسنتطلع فقط إلى إجراء عمليات بيع قصيرة. وبالمثل ، إذا كان السعر حاليًا أعلى من 200 فترة SMA ، فسنتطلع فقط إلى صفقات طويلة. هذا سوف يساعدنا على الإبقاء على الجانب الأيمن من السوق بالنسبة للجزء الأكبر.
ستستند إشارة دخول التجارة لدينا على خط Donchian المركزي. بافتراض أنه قد تم استيفاء مرشح SMA للفترة 200 ، سيتم البدء بتداول طويل عندما يتقاطع السعر ويغلق فوق مستوى 20 نقطة Donchian Centerline.
وعلى الجانب الآخر ، بافتراض أنه قد تم استيفاء مرشح SMA 200 فترة ، سيتم الشروع في صفقة قصيرة عندما يتقاطع السعر ويغلق أسفل خط الوسط خلال فترة 20 Donchian. هذه تقنية دخول بسيطة ولكنها قوية.
الآن بالنسبة لوضع وقف الخسارة ، سوف نضع حدا لأرجحة التداول الأخيرة قبل تقاطع خط الوسط Donchian. وبالنسبة إلى هدف جني الأرباح ، سنغلق ونخرج من التداول عندما تتقاطع الأسعار فوق خط الوسط في Donchian في الاتجاه المعاكس.
دعونا ننتقل الآن إلى الرسم البياني لسعر العملة أدناه والذي يوضح هذه الاستراتيجية بمزيد من التفاصيل:

Donchian-Trading-Strategy-1.png


Donchian التداول-الإستراتيجية-1
أعلاه هو الرسم البياني للأربع ساعات لزوج العملة التابع للدولار الأميركي مقابل الفرنك السويسري. تم تداول الأسعار في نطاق توطيد ضيق حول المتوسط المتحرك لـ200 فترة. ثم كان هناك شريط قوي على الجانب الصاعد الذي اخترق خط الوسط. كما أغلق نفس الشريط فوق المتوسط المتحرك البسيط 200. وقد لوحظ هذا الشريط الاختراق وتضخمت على الرسم البياني. لذا ، فإن الإشارة للدخول تحدث في نهاية هذا الشريط. ستوضع لدينا وقف أسفل هذا الشريط.
من هناك ارتفعت الأسعار بسرعة أعلى. ستة أشرطة بعد إشارة دخول ، ظهر نمط نجم اطلاق النار على الرسم البياني. التي كانت ستحذرنا من أن انخفاض الأسعار وشيك ممكن. بعد ذلك ، بدأت الأسعار في التوطيد بعض الشيء ولكن تحركت بعد ذلك إلى كسر أعلى من تشكيل النجوم. بعد ذلك بوقت قصير ، ظهر نمط نجم قصير ، والذي سيكون مرة أخرى تحذيرًا بأن الارتداد أو الانعكاس وشيك. بدأ السعر في الانخفاض بعد ظهور هذا النمط الثاني من النجوم. في نهاية المطاف عبرت خط الوسط Donchian وأغلقت تحتها. يمكنك أن ترى شريط الخروج وقد لوحظ وتضخمت على الرسم البياني. هذا من شأنه أن يكون بمثابة إشارة الخروج لدينا على التجارة.
Donchian Bollinger Band Squeeze
هذا الإعداد التالي الذي سنناقشه هو الذي أحبه وأشير إليه غالبًا في بيئات قليلة التقلب. يطلق عليه استراتيجية Donchian بولينجر باند الضغط. يجمع هذا الإعداد بين قناة Donchian و Bollinger Bands. إنه مزيج رائع للعثور على أسواق منخفضة التذبذب حيث من المرجح أن تنهار الأسعار قريبًا. المنطق الكامن وراء هذا النظام التجاري Donchian يكمن في الافتراض بأن الأسواق دورية بطبيعتها. ستكون هناك فترات من التقلبات المنخفضة يتبعها ارتفاع معدل التذبذب والعودة مرة أخرى. هذه هي الطريقة التي يتنفس بها السوق وهو الانحدار الطبيعي وتدفق معظم أزواج العملات والأدوات المالية الأخرى.
يحدث الإعداد عندما يتم احتواء كل من خطوط نطاق البولنجر العلوي والسفلي داخل قناة Donchian. الإعداد المستخدم في نطاقات Donchian هو نظرة الفترة الافتراضية 20 مرة أخرى. وبالنسبة إلى البولنجر باند ، سوف نستخدم أيضًا الإعداد الافتراضي لـ 20 فترة ، ولكن بالنسبة لهذا الانحراف المعياري ، سنستخدم 2.5 بدلاً من 2. وهذا يميل إلى العمل بشكل أفضل في تحديد ظروف التقلب الأقل التي تستعد للقيام بخطوة.
سوف تعتمد إشارة الدخول على خطوط Donchian العلوية والسفلية. لذلك ، سوف يتطلع نظام التداول إلى الدخول طويلاً عندما يتم احتواء البولنجر باند في الآونة الأخيرة ضمن قناة Donchian وكسر السعر ويغلق فوق المقاومة العليا للفرقة Donchian. وبالعكس ، سيبدو نظام التداول قصير المدى عندما تم احتواء البولنجر باند في الآونة الأخيرة ضمن قناة Donchian وكسر السعر وتوقف عن مستوى الدعم المنخفض للفرقة Donchian. من المهم أن تضع في اعتبارك أن خطوط البولنجر لا تحتاج بالضرورة أن تكون ضمن قناة Donchian في وقت الاختراق.
بالنسبة لوضع وقف الخسارة ، سنضع نقطة الوقف عند أحدث تأرجح قبل الاختراق مباشرةً. ولأجل تحقيق الربح ، سنغلق ونخرج من التداول المبني على أساس o
n 1.5: 1 RVR (نسبة مكافأة المخاطر).


You can refer to the trading example below which details the Donchian Bollinger Band Squeeze setup:

Donchian-Channel-System-2.png


In the above chart, we have the price action for the USDCHF pair using the 240 minute timeframe. Starting with the left side of the chart, we can see that prices were heading higher and made three minor tops prior to a swift price drop. After the price decline, prices began to consolidate and trade in a tight narrow range for several days. Towards the latter part of this low volatility market condition, the Bollinger Bands entered inside the Donchian channel.

This scenario confirms the trade setup, and we would be preparing for a breakout of either the lower Donchian support line or the upper Donchian resistance line. In this case, prices broke to the downside with a high momentum bar that closed beyond the Donchian Support line. The breakout bar that serves as the entry signal has been noted on the chart.

The stop loss would be place above the recent swing level and the upper wicks within the consolidation range. After the entry, prices traded sideways for a few days before moving sharply lower and hitting our take profit target. The take profit target, which is based on the 1:5 : 1 Reward to Risk ratio has been marked on the chart.

Download the short printable PDF version summarizing the key points of this lesson….Click Here to Download
Conclusion
As we have learned in this article, Donchian channels are a simple yet effective tool for trading breakouts. The general principles behind the indicator have been an inspiration to many traders around the world, particularly to trend following system traders. In fact, many of the greatest traders in the world including the famous “Turtles” used a variation of the Donchian channel to build their trend following system models.

The true power of the Donchian indicator is realized when you are able to combine it with other technical studies such as Moving Averages, Momentum, or Bollinger Bands to create a robust trading methodology. Now it’s your turn to take what you have learned and start applying it in the markets or even better to start building upon these concepts to improve on the ideas presented so that you can carve out your own variation of a Donchian channel trading system.


Twitter 0Tweet !function(d,s,id){var js,fjs=d.getElementsByTagName(s)[0];if(!d.getElementById(id)){js=d.createElement(s);js.id=id;js.src="//platform.twitter.com/widgets.js";fjs.parentNode.insertBefore(js,fjs);}}(document,"script","twitter-wjs");" style="box-sizing: border-box; position: absolute; top: 12px; left: 16px; width: 105px; min-height: 15px; text-align: left; line-height: 15px; bottom: 10px;">Facebook 0Google+0 (function() { var po = document.createElement("script"); po.type = "text/javascript"; po.async = true; po.src = "https://apis.google.com/js/plusone.js"; var s = document.getElementsByTagName("script")[0]; s.parentNode.insertBefore(po, s); })(); " style="box-sizing: border-box; position: absolute; top: 12px; left: 16px; width: 105px; min-height: 15px; text-align: left; line-height: 15px; bottom: 10px;">


FEATURED CATEGORIES
Featured Categories
SEARCH


aff_i


مكنك الرجوع إلى مثال التداول أدناه والذي يوضح تفاصيل إعداد Donchian Bollinger Band Squeeze:
Donchian قناة-نظام-2


Donchian-Channel-System-2.png


في الرسم البياني أعلاه ، لدينا حركة السعر لزوج USDCHF باستخدام الإطار الزمني 240 دقيقة. بداية من الجانب الأيسر من الرسم البياني ، يمكننا أن نرى أن الأسعار تتجه صعودًا وجعلت ثلاثة قمم صغيرة قبل الانخفاض السريع في الأسعار. بعد انخفاض الأسعار ، بدأت الأسعار في التماسك والتداول في نطاق ضيق ضيق لعدة أيام. نحو الجزء الأخير من حالة السوق منخفضة التقلب ، دخل البولنجر باند داخل قناة Donchian.
يؤكد هذا السيناريو على إعداد التداول ، وسنكون مستعدًا لاختراق خط الدعم دونشيز السفلي أو خط المقاومة دونشيان الأعلى. في هذه الحالة ، انكسرت الأسعار إلى الاتجاه الهبوطي مع وجود شريط زخم مرتفع مغلق خارج خط الدعم Donchian. وقد لوحظ شريط الاختراق الذي يعمل بمثابة إشارة دخول على الرسم البياني.
سيكون وضع وقف الخسارة أعلى من مستوى التأرجح الأخير والفتائل العلوية ضمن نطاق الدمج. بعد الدخول ، تم تداول الأسعار بشكل جانبي لبضعة أيام قبل أن تتحرك بشكل حاد إلى الأسفل وتصل إلى هدف جني الأرباح. تم وضع علامة على هدف أخذ الربح ، والذي يعتمد على نسبة 1: 5: 1 مكافأة إلى المخاطر على الرسم البياني.
قم بتنزيل نسخة PDF القصيرة القابلة للطباعة التي تلخص النقاط الرئيسية في هذا الدرس ... انقر هنا للتنزيل
استنتاج
كما تعلمنا في هذا المقال ، تعتبر قنوات Donchian أداة بسيطة وفعالة للتداول. لقد كانت المبادئ العامة وراء المؤشر مصدر إلهام للعديد من المتداولين في جميع أنحاء العالم ، ولا سيما الاتجاه التالي لتجار النظام. في الواقع ، استخدم العديد من أكبر المتداولين في العالم ، بما في ذلك "السلاحف" الشهيرة ، اختلافًا في قناة Donchian لبناء اتجاههم بعد نماذج النظام.
تتحقق القوة الحقيقية لمؤشر Donchian عندما تكون قادرًا على دمجها مع دراسات فنية أخرى مثل Moving Averages أو Momentum أو Bollinger Bands لإنشاء منهجية تداول قوية. حان دورك الآن لاتخاذ ما تعلمته والبدء في تطبيقه في الأسواق أو حتى أفضل للبدء في البناء على هذه المفاهيم لتحسين الأفكار المقدمة حتى تتمكن من استنباط تنوعك الخاص لنظام تداول قنوات Donchian.
T

How Much Do You Really Know About Trading Channels and Bands?

trading channels and bands.
 
بولنجر باندز


قام بولنجر باندز ، المطور من قبل جون بولينغر ، بتطوير نطاقات التذبذب فوق وتحت المتوسط المتحرك. يستند التقلب على الانحراف المعياري ، والذي يتغير مع زيادة التقلبات وانخفاضها. يتم توسيع العصابات تلقائيا عندما يزيد تقلب وتقلص عندما تقل سرعة التقلب. هذه الطبيعة الديناميكية لـ Bollinger Bands تعني أيضًا أنه يمكن استخدامها على أوراق مالية مختلفة مع الإعدادات القياسية. للإشارات ، يمكن استخدام Bollinger Bands لتحديد M-Tops و W-Bottoms أو لتحديد قوة الاتجاه. الإشارات المشتقة من تضييق النطاق الترددي تمت مناقشتها في مقالة ChartSchool في BandWidth.
ملاحظة: إن Bollinger Bands® هي علامة تجارية مسجلة لشركة John Bollinger.
حساب SharpCharts
* متوسط النطاق = متوسط متحرك بسيط لمدة 20 يومًا (SMA)
* Upper Band = SMA + 20 يومًا (انحراف معياري لمدة 20 يومًا للسعر × 2)
* Lower Band = SMA 20-day - (الانحراف المعياري لمدة 20 يومًا من السعر x 2)
جدول البيانات 1
انقر هنا لتنزيل مثال جدول البيانات هذا.
يتكون Bollinger Bands من شريط وسطى مع شريطين خارجيين. النطاق المتوسط هو متوسط متحرك بسيط يتم تعيينه عادةً على 20 فترة. يستخدم المتوسط المتحرك البسيط لأن صيغة الانحراف المعياري تستخدم أيضًا متوسط متحرك بسيط. فترة العودة إلى الانحراف المعياري هي نفسها بالنسبة للمتوسط المتحرك البسيط. عادة ما يتم تعيين النطاقات الخارجية على 2 الانحرافات المعيارية فوق وتحت النطاق الأوسط.

bbs-1-spyexam.png


يمكن ضبط الإعدادات لتتناسب مع خصائص بعض الأوراق المالية أو أنماط التداول. ينصح بولينجر بإجراء تعديلات تدريجية صغيرة على مضاعف الانحراف المعياري. يؤثر تغيير عدد الفترات بالنسبة للمتوسط المتحرك أيضًا على عدد الفترات المستخدمة لحساب الانحراف المعياري. لذلك ، لا يلزم سوى تعديلات صغيرة لمضاعف الانحراف المعياري. الزيادة في متوسط الفترة المتحركة ستزيد تلقائيًا من عدد الفترات المستخدمة لحساب الانحراف المعياري وستزيد أيضًا مضاعف الانحراف المعياري. مع 20 يوما SMA و 20 يوما الانحراف المعياري، يتم تعيين مضاعف الانحراف المعياري في 2. باند يقترح زيادة مضاعف الانحراف المعياري 2.1 ل50-SMA فترة وخفض مضاعف الانحراف المعياري 1.9 عن الفترة 10 SMA.
إشارة: W-Bottoms
كانت W-Bottoms جزءًا من أعمال آرثر ميريل ، التي حددت 16 نمطًا مع شكل W الأساسي. يستخدم بولينجر أنماط W المختلفة هذه باستخدام Bollinger Bands لتحديد W-Bottoms. يتكون نموذج "W-Bottom" في ترند هابط وينطوي على قيعان رد فعل. على وجه الخصوص ، يبحث Bollinger عن W-Bottoms حيث يكون القاع الثاني أقل من الأول ولكنه يحمل فوق النطاق السفلي. هناك أربع خطوات لتأكيد W-Bottom مع خطوط بولينجر. أولا ، أشكال رد فعل منخفضة. عادة ما يكون هذا الانخفاض منخفضًا ، ولكن ليس دائمًا ، أسفل النطاق السفلي. ثانيًا ، هناك ارتداد نحو النطاق المتوسط. ثالثًا ، هناك سعر منخفض جديد في الأمن. هذا المنخفض يحمل فوق النطاق السفلي. تظهر القدرة على الصمود فوق النطاق السفلي في الاختبار ضعفًا أقل عند الانخفاض الأخير. رابعاً ، يتم تأكيد النمط بحركة قوية من القاع الثاني وكسر الشوط.


bbs-2-jwnwbot.png


يظهر الرسم البياني 2 نوردستروم (JWN) مع W-Bottom في يناير وفبراير 2010. أولاً ، شكل السهم رد فعل منخفضًا في يناير (سهم أسود) وكسر أسفل النطاق السفلي. ثانيًا ، كان هناك ارتداد إلى الخلف فوق النطاق المتوسط. ثالثًا ، انتقل السهم إلى ما دون قاعه في يناير ، واستقر فوق الحد السفلي. على الرغم من أن قاع 5 فبراير / شباط المفاجئ قد حطم النطاق السفلي ، يتم حساب Bollinger Bands باستخدام أسعار الإغلاق ، لذا يجب أن تعتمد الإشارات أيضًا على أسعار الإغلاق. رابعاً ، ارتفع السهم بتوسع حجمه في أواخر شهر فبراير وكسر فوق قمة فبراير. يعرض الرسم البياني 3 Sandisk مع W-Bottom أصغر حجمًا في يوليو وأغسطس 2009.


bbs-3-sndkwbot.png


إشارة: M-Tops
كانت M-Tops أيضًا جزءًا من أعمال آرثر ميريل ، التي حددت 16 نمطًا مع شكل M الأساسي. تستخدم بولينجر هذه الأنماط M المختلفة مع Bollinger Bands لتحديد M-Tops. وفقًا لبولينجر ، تكون القمم عادة أكثر تعقيدًا ورسمًا من القاع. تمثل القمم المزدوجة وأنماط الرأس والكتفين والماس قمم متطورة.
في أبسط أشكالها ، تشبه M-Top قمة مزدوجة. ومع ذلك ، فإن مستويات التفاعل غير متساوية دائمًا. يمكن أن يكون الارتفاع الأول أعلى أو أقل من القمة الثانية. يقترح بولينغر البحث عن علامات عدم التأكيد عندما يقوم الأمن بتحقيق ارتفاعات جديدة. هذا هو في الأساس عكس W-Bottom. يحدث عدم التأكيد بثلاث خطوات. أولاً ، ينشئ الأمان رد فعل عاليًا فوق النطاق العلوي. ثانيًا ، هناك تراجع نحو النطاق المتوسط. ثالثًا ، تتحرك الأسعار فوق أعلى المستويات ، لكنها تفشل في الوصول إلى النطاق الأعلى. هذه علامة تحذير. إن عدم قدرة رد الفعل الثاني المرتفع للوصول إلى النطاق الأعلى يظهر زخم تراجع ، والذي يمكن أن ينذر بعكس الاتجاه. يأتي التأكيد النهائي مع وجود كسر دعم أو إشارة مؤشر هبوطي.

bbs-4-xommtop.png


الرسم البياني 4 يبين Exxon Mobil (XOM) مع M-Top في أبريل ومايو 2008. تحرك السهم فوق النطاق العلوي في أبريل. كان هناك تراجع في مايو ثم دفعة أخرى فوق 90. على الرغم من أن السهم تحرك فوق النطاق العلوي على الأنظمة الزمنية اللحظية ، فإنه لم يغلق فوق النطاق العلوي. تم تأكيد M-Top مع توقف الدعم بعد أسبوعين. لاحظ أيضًا أن الماكد شكل انحرافًا هبوطيًا وتحرك تحت خط الإشارة للتأكيد

bbs-5-phmmtop.png


يظهر الرسم البياني 5 Pulte Homes (PHM) في اتجاه صعودي في يوليو وأغسطس 2008. تجاوز السعر النطاق الأعلى في أوائل سبتمبر لتأكيد الاتجاه الصعودي. بعد التراجع دون المتوسط المتحرك لـ 20 يوم (المتوسط باند بولينجر) ، انتقل السهم إلى أعلى مستوى أعلى من 17. وعلى الرغم من هذا الارتفاع الجديد للحركة ، فإن السعر لم يتجاوز النطاق العلوي. هذا تومض علامة تحذير. كسر السهم الدعم بعد أسبوع ، وتحرك مؤشر MACD تحت خط الإشارة. لاحظ أن هذا M-top أكثر تعقيدًا نظرًا لحدوث انخفاض في ردود الفعل على كلا جانبي القمة (السهم الأزرق). شكلت هذه القمة المتطورة نمطًا صغيرًا للرأس والكتف.
إشارة: المشي على العصابات
إن التحركات فوق أو أسفل النطاقات ليست إشارات بحد ذاتها. وكما يوضحه بولينجر ، فإن التحركات التي تلمس أو تتجاوز النطاقات ليست إشارات ، وإنما هي "علامات". على وجهه ، يظهر الانتقال إلى النطاق الأعلى القوة ، في حين أن الحركة الحادة إلى النطاق السفلي تظهر ضعفًا. تعمل مؤشرات التذبذب بشكل كبير بنفس الطريقة. ذروة الشراء ليست بالضرورة صعودية. يتطلب الأمر قوة للوصول إلى مستويات التشبع في الشراء وقد تمتد ظروف التشبع في الشراء في اتجاه صعودي قوي. وبالمثل ، يمكن للأسعار أن "تسير على نطاق واسع" مع العديد من اللمسات خلال اتجاه صعودي قوي. فكر في الأمر للحظة. النطاق العلوي هو انحرافان معياريان فوق المتوسط المتحرك البسيط لـ 20 فترة. يتطلب تحرك سعر قوي جدًا لتجاوز هذا النطاق العلوي. إن اللمسة العليا التي تحدث بعد أن ثبتت بولينجر باند أن W-Bottom ستشير إلى بداية الترند الصاعد. وكما أن الترند الصاعد القوي ينتج عددًا من علامات النطاق العلوي ، فمن الشائع أيضًا ألا تصل الأسعار أبدًا إلى النطاق السفلي خلال الترند الصاعد. المتوسط المتحرك لـ 20 يومًا يعمل أحيانًا كدعم. في الواقع ، فإن الانخفاضات دون المتوسط المتحرك لـ 20 يومًا توفر أحيانًا فرص شراء قبل العلامة التالية في النطاق الأعلى.


bbs-6-apdwalk.png


الرسم البياني 6 يبين منتجات Air (APD) مع زيادة وإغلاق فوق النطاق العلوي في منتصف يوليو. أولاً ، لاحظ أن هذا هو الارتفاع القوي الذي تجاوز مستوى المقاومة. القوة الدافعة القوية هي علامة على القوة وليس الضعف. تحول التداول إلى مستوى ثابت خلال شهر أغسطس وتحرك المتوسط المتحرك لـ 20 يومًا بشكل جانبي. وضيق نطاق البولنجر باند ، لكن مؤشر أسعار الصرف لم يغلق أسفل النطاق السفلي. الأسعار و SMA 20 يوم ظهر في سبتمبر. وعموما ، أغلقت APD فوق النطاق العلوي لمدة خمس مرات على الأقل خلال فترة أربعة أشهر. تعرض نافذة المؤشر مؤشر قناة السلع لمدة عشر سنوات (CCI). الانخفاضات تحت -100 تعتبر ذروة البيع وتحرك مرة أخرى فوق -100 إشارة بداية ارتداد ذروة البيع (الخط الأخضر المنقط). بدأت علامة النطاق العلوي والاختراق في الترند الصاعد. ثم حددت CCI التراجعات القابلة للتداول مع الانخفاضات تحت -100. هذا مثال على الجمع بين Bollinger Bands مع مذبذب الزخم لإشارات التداول.

bbs-7-monwalk.png


البولنجر باند - الرسم البياني 7
يوضح الرسم البياني 7 مونسانتو (MON) مع السير أسفل الشريط السفلي. هبط السهم في يناير بفاصل دعم وأغلق دون النطاق السفلي. من منتصف يناير إلى أوائل مايو ، أغلقت Monsanto أسفل الفرقة السفلى خمس مرات على الأقل. لاحظ أن السهم لم يغلق فوق النطاق العلوي مرة واحدة خلال هذه الفترة. يشير توقف الدعم والإغلاق المبدئي تحت النطاق السفلي إلى اتجاه هبوطي. على هذا النحو ، تم استخدام مؤشر قناة السلع لمدة عشر سنوات (CCI) لتحديد حالات ذروة الشراء على المدى القصير. التحرك فوق +100 هو ذروة الشراء. العودة إلى ما دون +100 تشير إلى استئناف الاتجاه الهبوطي (الأسهم الحمراء). أثار هذا النظام اثنين من الإشارات الجيدة في أوائل عام 2010.
الاستنتاجات
تعكس خطوط البولنجر الاتجاه مع SMA 20 فترة والتقلب مع النطاقات العلوية / السفلية. على هذا النحو ، يمكن استخدامها لتحديد ما إذا كانت الأسعار مرتفعة أو منخفضة نسبيا. وفقًا لبولينجر ، يجب أن تحتوي النطاقات على 88-89٪ من حركة السعر ، مما يجعل التحرك خارج النطاق هامًا. من الناحية الفنية ، تكون الأسعار مرتفعة نسبيًا عندما تكون أعلى من النطاق العلوي وتكون منخفضة نسبيًا عند أسفل النطاق السفلي. ومع ذلك ، لا ينبغي اعتبار ارتفاع نسبي كإشارة هبوطية أو بيع. وبالمثل ، لا ينبغي اعتبار السعر المنخفض نسبيًا إشارة صعودية أو كإشارة شراء. الأسعار مرتفعة أو منخفضة لسبب ما. كما هو الحال مع المؤشرات الأخرى ، لا يُقصد استخدام Bollinger Bands كأداة قائمة بذاتها. يجب أن يدمج المخططون خطوط بولينجر مع تحليل الاتجاه الأساسي ومؤشرات أخرى للتأكيد.
باستخدام SharpCharts
يمكن العثور على Bollinger Bands في SharpCharts كتراكب سعر. كما هو الحال مع المتوسط المتحرك البسيط ، يجب أن يتم عرض Bollinger Bands على قمة مؤامرة السعر. بعد تحديد Bollinger Bands ، سيظهر الإعداد الافتراضي في معلمات النافذة (20،2). يحدد الرقم الأول (20) فترات المتوسط المتحرك البسيط والانحراف المعياري. يحدد العدد الثاني (2) مضاعف الانحراف المعياري للنطاقات العليا والدنيا. تحدد هذه المعلمات الافتراضية الانحرافات المعيارية للنطاقات 2 فوق / تحت المتوسط المتحرك البسيط. يمكن للمستخدمين تغيير المعلمات لتناسب احتياجات التخطيط الخاصة بهم. يمكن استخدام خطوط بولينجر (50،2.1) لفترة زمنية أطول أو يمكن استخدام خطوط بولينجر (10،1.9) في إطار زمني أقصر. انقر هنا للحصول على مثال حي.
البولنجر باند - Sharpcharts
عمليات المسح المقترحة
البولنجر باند كروس
يبحث هذا الفحص عن الأسهم التي انتقلت للتو عبر خط بولينجر باند العلوي. هذا المسح هو مجرد نقطة انطلاق. مطلوب مزيد من الصقل والتحليل.
[type = stock] و [country = US]
و [يوميًا SMA (20 ، حجم يومي)> 40000]
AND [SMA Daily (60، Daily Close)> 5]
و [Daily Close x Daily Upper BB (20،2.0)]
اتجاه فرعي بولينجر باند كروس أوفر
يجد هذا الفحص المخزون الذي انتقل للتو تحت خط البولنجر باند السفلي. هذا المسح هو مجرد نقطة انطلاق. مطلوب مزيد من الصقل والتحليل.
[type = stock] و [country = US]
و [يوميًا SMA (20 ، حجم يومي)> 40000]
AND [SMA Daily (60، Daily Close)> 5]
و [Daily Lower BB (20،2.0) x Daily Close]
لمزيد من التفاصيل حول البنية المستخدمة في عمليات مسح Bollinger Band ، يرجى الاطلاع على مرجع مؤشر المسح الضوئي في مركز الدعم.
موارد إضافية
الاسهم والسلع مقالات المجلات
Bollinger Bands بواسطة ايمي وو
Dec 2001 - Stock & Commodities V. 20: 1 (78-79)
استخدام خطوط بولينجر بواسطة جون بولينغر
يناير 1992 - الأسهم والسلع V. 10: 2 (47-51)
الخطوط العريضة
خطوط بولينجر
مقدمة
حساب SharpCharts
إشارة: W-Bottoms
إشارة: M-Tops
إشارة: المشي على العصابات
الاستنتاجات
باستخدام SharpCharts
عمليات المسح المقترحة
البولنجر باند كروس
اتجاه فرعي بولينجر باند كروس أوفر
موارد إضافية
الاسهم والسلع مقالات المجلات

المصدر : school:chart
 
471c0acf97


شارت سهم أعيان يبين تقاطع كل من
السعر مع المتوسطات 50 --- 100 --- 200
و تقاطع المتوسطات مع بعضها ..

و دور كل منها في الاشارة الى الاتجاه القادم للسعر ......
 
Bullish Bearish Indicator

مؤشر الاتجاه الهابط التصاعدي - كيفية استخدامه
30/03/2010 بواسطة admin192
يظهر مؤشر الاتجاه الهبوطي الصاعد العلاقة بين المؤشرات الصعودية والهابطة. تظهر القراءات الأعلى أن السوق صعودي للغاية وبالتالي يجب أن يكون السوق أعلى وليس علامة للشراء. وبالمثل ، تظهر القراءات المنخفضة أن السوق هبوطية للغاية وبالتالي يجب أن يكون قاع السوق الذي سيوفر فرصة للشراء.
يوضح المؤشر النسبة المئوية لمكونات السوق التصاعدية والهابطة ضمن ورقة مالية أو مؤشر معين.
إذا كان هناك فرق كبير (> 30٪) بين النسبة المئوية للمكونات الصاعدة والهبوطية فهذا يعني أن هناك كمية غير مبررة من الاتجاه الصعودي في السوق وهذا يحدث عادة خلال قمة قريبة. والعكس صحيح بالنسبة إلى الاتجاه الهبوطي في السوق وعادة ما يصور قاعًا قريبًا.


http://www.niftylivecharts.com/blog/bullish-bearish-indicator/
 
عودة
أعلى