تثبيت التطبيق
How to install the app on iOS
Follow along with the video below to see how to install our site as a web app on your home screen.
ملاحظة: This feature may not be available in some browsers.
أنت تستخدم أحد المتصفحات القديمة. قد لا يتم عرض هذا الموقع أو المواقع الأخرى بشكل صحيح.
يجب عليك ترقية متصفحك أو استخدام أحد المتصفحات البديلة.
يجب عليك ترقية متصفحك أو استخدام أحد المتصفحات البديلة.
مكتبة المؤشرات و النماذج ....
- بادئ الموضوع السيب
- تاريخ البدء
- ما هى الأنماط السعريه و ما هى طريقة أستخدامها و نبذه عن مؤلفها و تاريخها
- الرأس و الكتفين Head and shoulders
- القمه المزدوجه DOUBLE TOP
- نموذج القاع المزدوج Double bottom
- نموذج القمم الثلاثه Triple top
- نموذج القيعان الثلاثه Triple bottom
- الكوب و العروه cup and handle
- نموذج المثلث متساوى الساقين symmetrical triangle
- نموذج المثلث الصاعد ascending triangle
- نموذج المثلث الهابط descending triangle
- نموذج الوتد الصاعد ascending wedge
- نموذج الوتد الهابط descending wedge
- نموذجى العلم و الرايه pennant and flag
- نموذج المستطيل rectangle
- القنوات الصاعده up channels
- القنوات الهابطه down channels
ﻓﻬﺮﺱ
موقع للنماذج
https://www.arabictrader.com/ar/knowledge-base/details/68/نموذج-المثلث-المتماثل-symmetrical-triangle
موقع للنماذج
https://www.arabictrader.com/ar/knowledge-base/details/68/نموذج-المثلث-المتماثل-symmetrical-triangle
- 1مقدمة في النماذج الفنية
- 2نموذج القمة الثنائية (Double Top)
- 3نموذج القاع الثنائي (Double Bottom)
- 4نموذج القمة الثلاثية (Triple Top)
- 5نموذج القاع الثلاثي (Triple Bottom)
- 6نموذج الرأس والكتفين (Head & Shoulders)
- 7نموذج الرأس والكتفين المقلوب (Inverted Head & Shoulders)
- 8نموذج المثلث المتماثل (Symmetrical Triangle)
- 9المثلث الصاعد (Ascending triangle)
- 10المثلث الهابط (Descending Triangle)
- 11النموذج المتباعد (Boarding Pattern)
- 12نموذج المستطيل (Rectangle)
- 13الأعلام والأعلام المثلثة (Flags & Pennants)
- 14نموذج الوتد الصاعد (Rising Wedge)
- 15نموذج الوتد الهابط (Falling Wedge)
- 16نموذج القمم المستديرة (Rounding Tops)
- 17نموذج القيعان المستديرة (Rounding Bottoms)
- 18نموذج القمة (V Top Pattern) - (V)
- 19نموذج القاع (V Bottom Pattern) - (V)
https://www.arabicbroker.com/10896.html
الرئيسية استراجيات ومؤشرات التداول استراتيجية تعليم التحليل الفني المثلثات
الرئيسية استراجيات ومؤشرات التداول استراتيجية تعليم التحليل الفني المثلثات
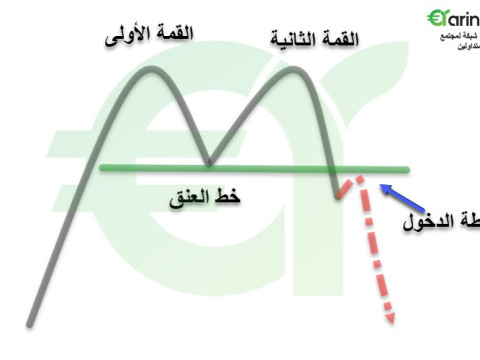
نموذج القمتين بالشرح المبسط بالأشكال والرسوم
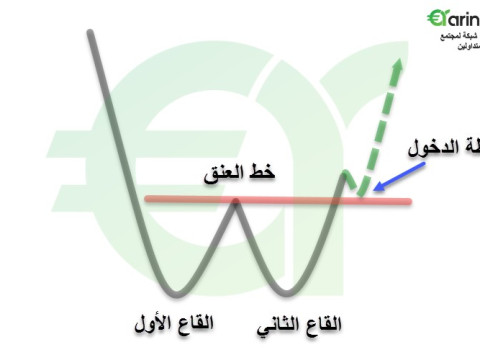
خصائص نموذج القاعين وأشكالها الموضحة
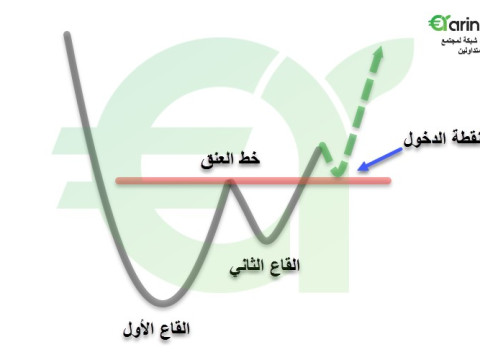
شكل نموذج الكوب والعروة وخصائصة
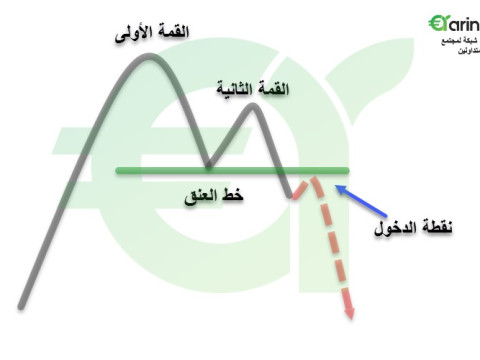
خصائص نموذج الكوب والعروة المقلوب بالتفصيل
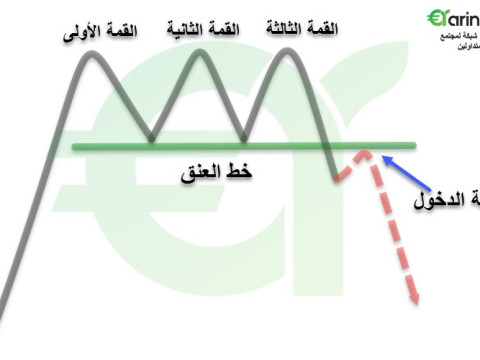
كل ما يخص نموذج الثلاث قمم
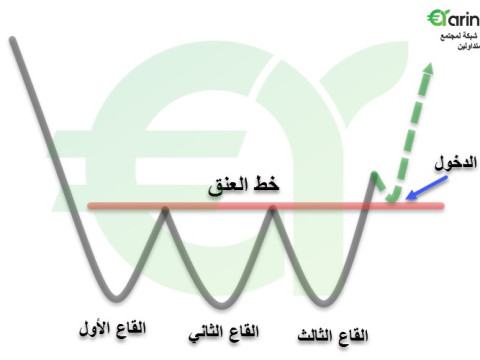
نموذج الثلاث قيعان شرح وخصائص
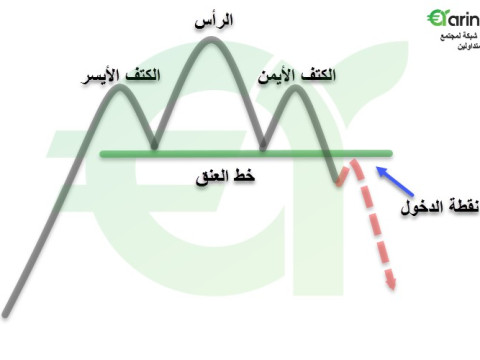
نموذج الرأس والكتفين خصائصه ومميزاته
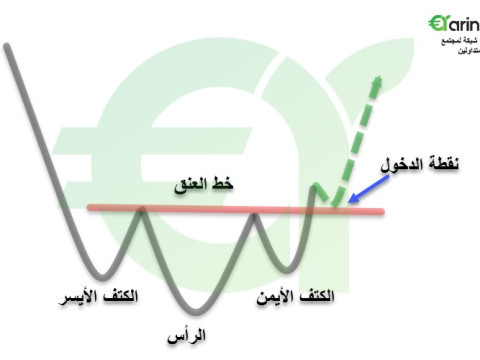
خصائص نموذج الرأس والكتفين المقلوب موضحا بالرسم
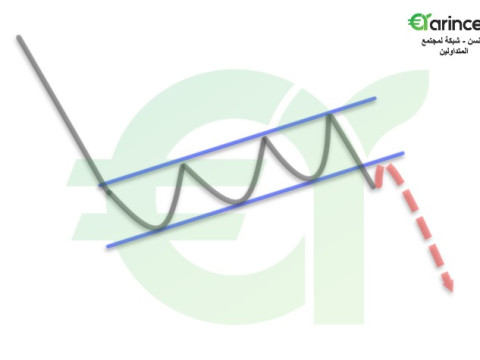
مفهوم نموذج العلم وأقسامه الموضحة بالشكل
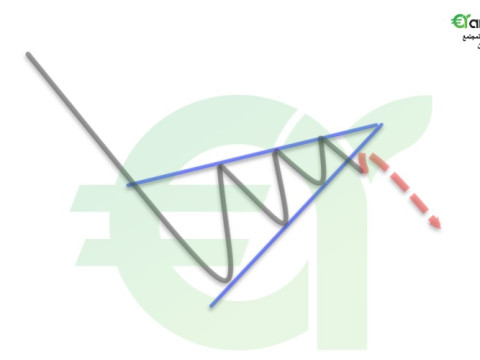
نموذج الوتد الصاعد بالشرح المبسط
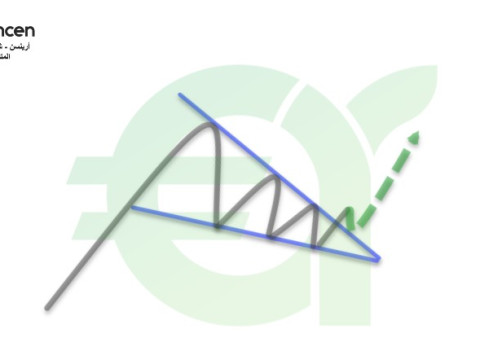
شكل وخصائص الوتد الهابط Falling Wedge
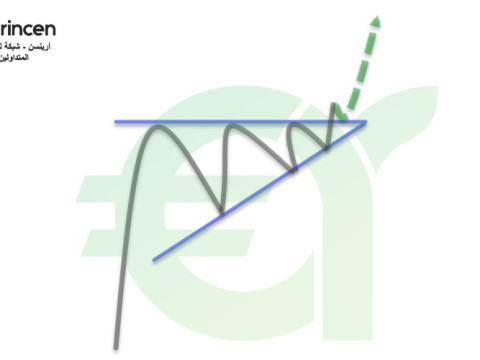
شكل المثلث الصاعد Ascending triangle وخصائصه
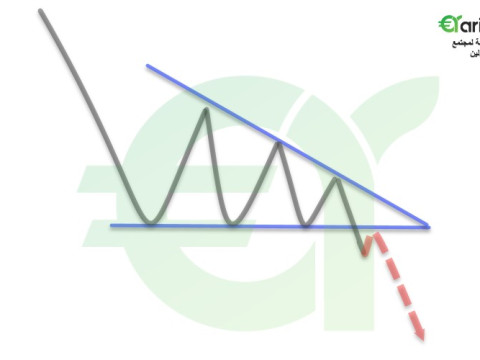
المثلث الهابط خصائص ومميزات موضحة بالشكل
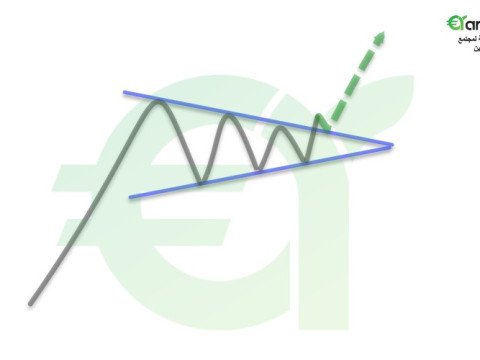
https://arincen.com/forex-text-academy/15/71
موقع نماذج فيه شرح مسهب للنماذج
https://forex-arabic.com/showthread...نماذج-السعريه-العمل-بها-جيد-ام-لا؟&p=11067769
https://forex-arabic.com/showthread...نماذج-السعريه-العمل-بها-جيد-ام-لا؟&p=11067769
النماذج الانعكاسية
1 _ نموذج الراس و الكتفين
1 _ نموذج الراس و الكتفين
ملاحظات مهمة
_ تزداد الكمية في حالة كسر او اختراق خط العنق
_ الكتفين متقاربين بمستوى القمم
_ قد يمتد النموذج فيتكون خط عنق ثاني بالاسفل او بالاعلى
_ قد يتكرر بصورة متعاقبة و متلاصقه
_ قد يتشكل بين اتجاهين متعاكسين
تطبيقات من الاسواق الاجنبية
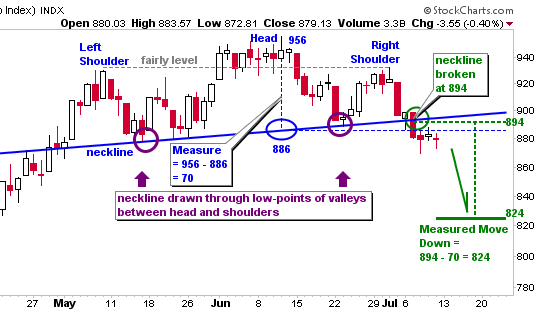
https://www.google.com/url?sa=i&source=images&cd=&cad=rja&uact=8&ved=2ahUKEwjrnKH31MbkAhUNdBQKHSkIBq0Qjhx6BAgBEAI&url=http://thestockmarketwatch.com/learn/head-and-shoulders-pattern/&psig=AOvVaw3sFOBFEyQ1iS1Am4m36gOw&ust=1568215179601114

https://www.google.com/url?sa=i&source=images&cd=&ved=2ahUKEwinoZOq08bkAhUs5uAKHcNMAw0Qjhx6BAgBEAI&url=https://dailypriceaction.com/blog/head-and-shoulders-pattern/&psig=AOvVaw3sFOBFEyQ1iS1Am4m36gOw&ust=1568215179601114
_ قد يمتد النموذج فيتكون خط عنق ثاني بالاسفل او بالاعلى

https://www.google.com/url?sa=i&source=images&cd=&cad=rja&uact=8&ved=2ahUKEwihi9mY2sbkAhWnAGMBHTVZA7gQjhx6BAgBEAI&url=https://www.investorschronicle.co.uk/2011/09/08/tips-and-ideas/trading-ideas/city-trades/city-trade-eurostoxx-s-bearish-outlook-y5szD1zt9rhnB0VfC1IyDO/article.html&psig=AOvVaw3sFOBFEyQ1iS1Am4m36gOw&ust=1568215179601114
الافضل التقارب بين الكتفين و لكن ليس شرطا .. ممكن ان يكون هناك فارق كبير بين الكتفين
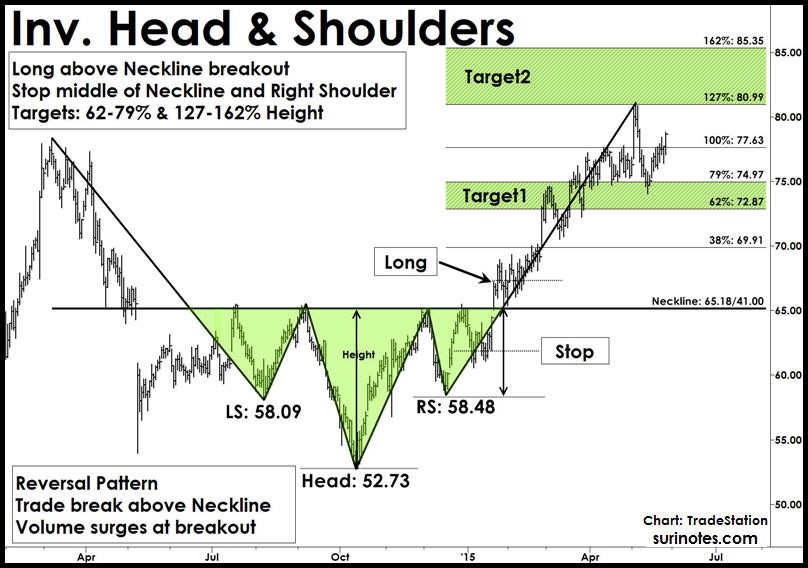
https://www.google.com/url?sa=i&source=images&cd=&cad=rja&uact=8&ved=2ahUKEwjB--So28bkAhV85OAKHUuvAEsQjhx6BAgBEAI&url=https://www.moneyshow.com/articles/tradingidea-52314/&psig=AOvVaw3sFOBFEyQ1iS1Am4m36gOw&ust=1568215179601114
قد تحسب المسافة من بداية الاتجاه ..فيتكون شكل w ممتد الطرفين في النموذج المقلوب او العكس في النموذج المعتدل
Short Explanation: The Head and Shoulders chart pattern
medium.com
و قد يكون هكذا و يحسب من امتداداته من بداية الاتجاه
Price Action Trading Strategy- The Definitive Guide
hopepiusfx.com
ممكن ان تكون القمة مكونة من عدة قمم
صور و شارتات للنموذج
https://www.google.com/search?q=hea...AUIEigB&biw=1163&bih=525#imgrc=vfP7rxrvprX7BM:
التعديل الأخير بواسطة المشرف:
ForexTraining Group
Keys to Identifying and Trading the Head and
Shoulders Pattern
FOREX TRADING ARTICLES
Download the short printable PDF version summarizing the key points of this lesson….Click Here to Download
Head and Shoulders Pattern in Forex
The Head and Shoulders pattern is a chart figure which has a reversal character. As you might image, the name of the formation comes from the visual characteristic of the pattern – it appears in the form of two shoulders and a head in between. The pattern starts with the creation of a top on the chart. The price action then creates a second top, which is higher than the first top. A third top is created afterwards, but it is lower than the second top and is approximately at the same level as the first top.
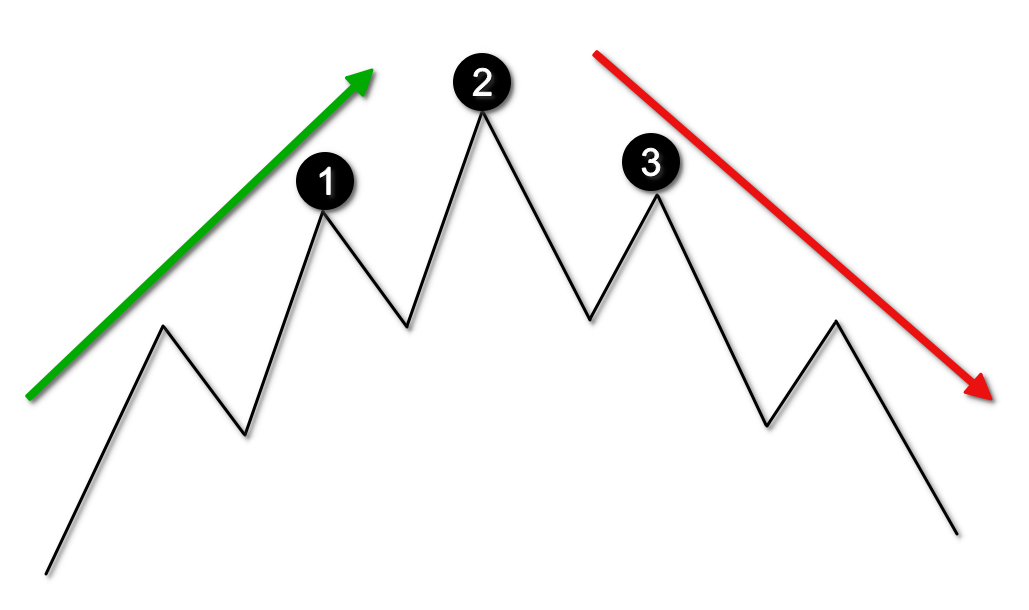
The image above is a sketch of the Head and Shoulders chart pattern. The tops at (1), (2), and (3) create the three important swing points of the pattern.

Psychology of the H&S Technical Pattern
As I have mentioned, the Head and Shoulders formation is a reversal chart pattern. In this manner, the formation represents the loss of faith in the prevailing trend. The right shoulder on the chart which is lower than the head presents some important clues to the trader. The tops have been increasing initially until the creation of the third top (right shoulder). This decreasing top on the chart, represents the deceleration of the trend which is likely to lead to a trend reversal.
Head and Shoulders Pattern Rules
Let’s now discuss some trading rules surrounding the Head and Shoulders Pattern. After we go through these guidelines, you will be ready to start scanning for this pattern on your own price charts.
Drawing the Head and Shoulders Chart Pattern
The first important sign of an emerging Head and Shoulders reversal pattern comes from the bottom created after the head is formed. If you have and established trend on the chart, this bottom is likely to create a slowdown in the trend’s intensity. In many cases this bottom also creates a breakout from a bullish trend line.
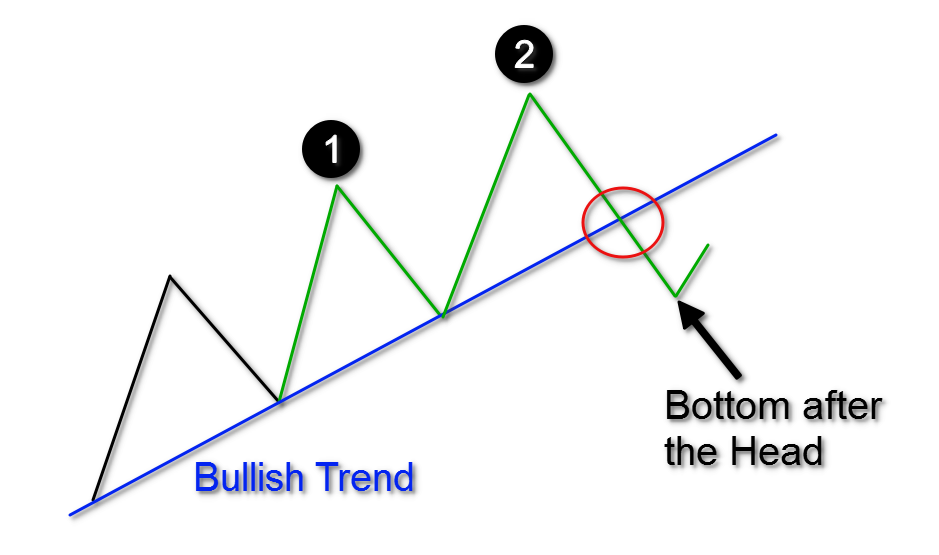
This is the first indication of a reversal potential and an emerging Head and Shoulders reversal pattern on the chart. We have two tops which are increasing and correspond to the bullish trend. However, the bottom created after the head formation, typically breaks the trend line and ends near the same level as the previous bottom. This indicates that the bullish momentum is slowing.
After the head is completed, followed by a bottom outside the trend line, we should anticipate the third top, which will be lower than the head. Sometimes, during the formation of the right shoulder, price may test the already broken trendline as a resistance.
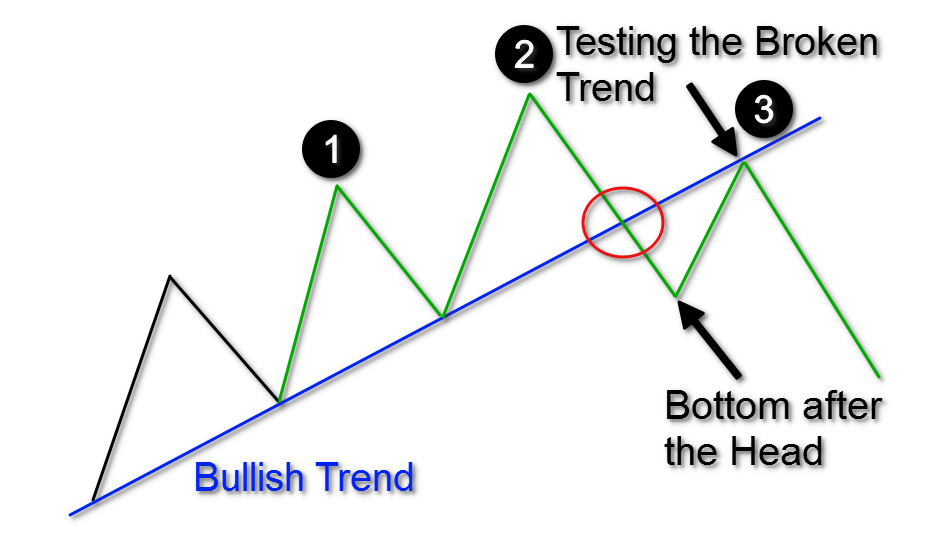
The creation of a third, lower top on the chart creates the H&S formation on the chart. However, this doesn’t mean that the pattern is confirmed. We will discuss how to confirm a valid Head and Shoulders pattern in the next section.
Head and Shoulders Neckline
The Head and Shoulders neckline is considered the most important component in trading the H&S pattern. The reason for this is that the H&S neckline acts as the trigger line for trading the pattern.
The neckline needs to be manually drawn on your chart. To draw the neckline, you need to locate two bottoms – the bottom just prior to the head formation, and the bottom just after the head formation. Then you should connect these two swing points with a line.
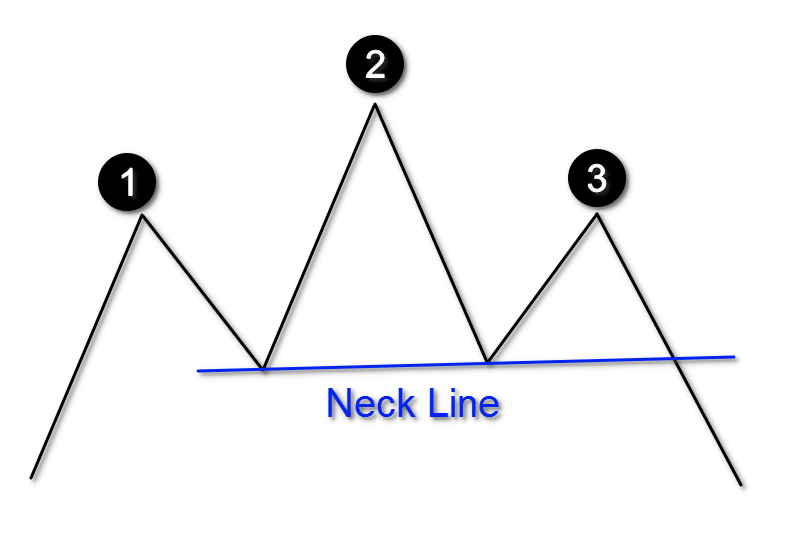 The sketch above shows you how a Head and Shoulder neckline should be built. It is important to note that this line could be horizontal, or it could be inclined if the H&S chart pattern is inclined itself. Also, it is possible for the neckline to be declined, but that is less common. Regardless, it makes no difference whether the pattern has a straight, inclined, or declined neckline, as long as the price action follows the Head and Shoulders pattern rules.
Learn What Works and What Doesn’t In the Forex Markets….Join My Free Newsletter Packed with Actionable Tips and Strategies To Get Your Trading Profitable…..Click Here to Join
Head and Shoulders Breakout
The Head and Shoulders breakout is the signal we need in order to open a short trade. To get a valid H&S breakout, we need to see the price action breaking through the neck line of the pattern. It is when a candle closes below the neckline, that a short signal is triggered for the Head and Shoulders setup.
Head and Shoulders Stop Loss
The Head and Shoulders trade setup should be used in conjunction with a stop loss order. Obviously, the H&S pattern, like any other pattern, does not provide a 100% success rate, so we must protect our trading account in case price moves against us.

The optimal place for your stop loss order is above the second shoulder on the chart. This corresponds to top (3). When you short the Forex pair after a Head and Shoulders breakout signal, you place the stop above the 3rd top of the pattern.
Head and Shoulders Price Target
The next question we must ask ourselves is “How long should we stay in the Head and Shoulders trade?” The answer to this question is a two-step process:
Measuring the Size of the Head and Shoulders Pattern
The size of the Head and Shoulders structure holds a direct relationship with the potential target for the trade. Therefore, it is paramount to understand how to measure the size of the H&S pattern. To do so, you need to take the distance between the tip of the head and the neck line. This will yield the size of the head and shoulders pattern.
Applying the Size of the Head and Shoulders Pattern
Now that you have the size of your H&S pattern on the chart, you should apply this length downwards, starting from the initial breakout through the neck line. This is the price move you should expect when trading the Head and Shoulders setup. In other words, the expected price move after the H&S pattern equals to the size of the pattern. This is often referred to by chart technicians as a measured move. Take a look at the diagram below:
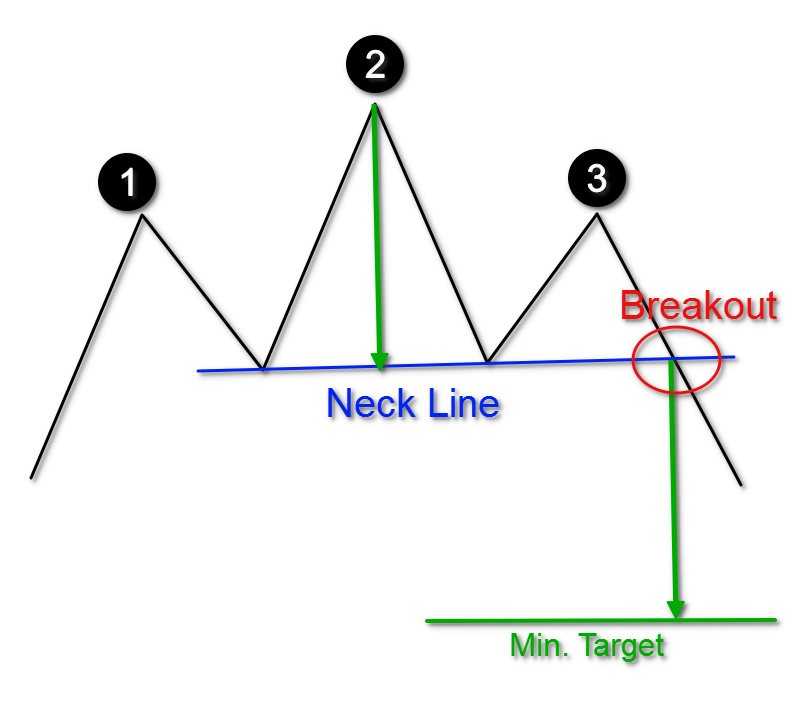 Notice that in this diagram, we have applied the target of the Head and Shoulders pattern. The size should match the distance between the head and the neck as shown on the image. After you measure the size, you simply add it downwards from the point of the breakout. When the price reaches the minimum target, it is an opportune time to close out the trade in full, or at least a sizable portion of it.
So, as an option you can keep a portion of your position open beyond the minimum target. After all, if the price is trending in your favor, you may want to see if you can catch a runner. If you want to extend the target on the chart, you can do this by using simple price action rules or a trailing stop. Be on the lookout for important support and resistance levels, as well as trend lines, price channels, or reversal candles and chart patterns. Each of these might help you to determine your exit point on the chart.
Inverted Head and Shoulders Pattern
The Head and Shoulders pattern has its bullish equivalent. This is the inverted Head and Shoulders pattern. Contrary to the H&S pattern, the inverse H&S pattern appears during a bearish trend and it implies that the existing bearish tendency is likely to be reversed.
This pattern looks the same as the standard Head and Shoulders, but inverted. And so, the inverted Head and Shoulders pattern formation concerns bottoms, and not tops. This is how the inverted Head and Shoulders figure appears:
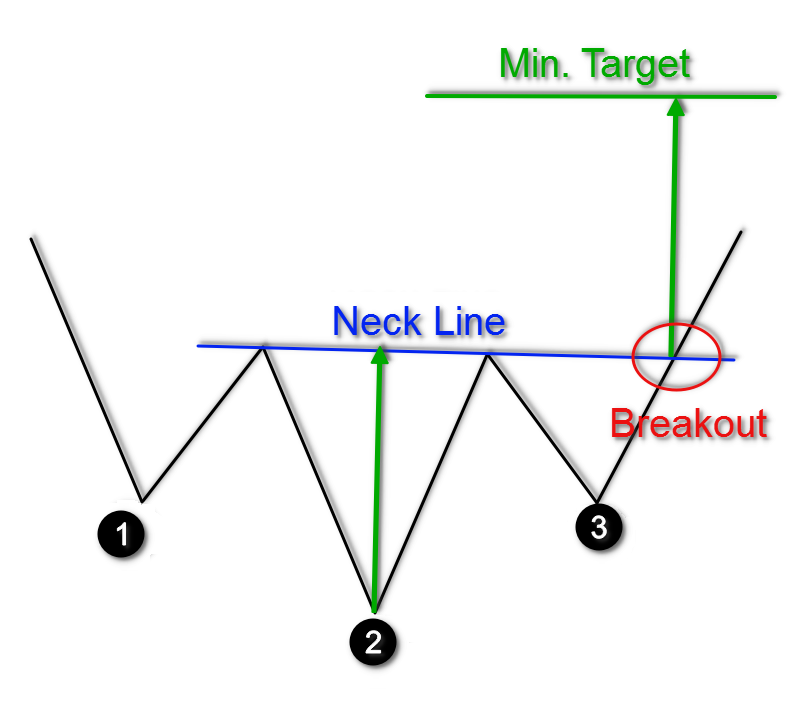
This sketch shows you that the inverse Head and Shoulders is an exact mirror replica of the Head and Shoulders pattern. Thus, the potential of the formation is reversed. The Head and Shoulders pattern has a bearish potential outlook, while the inverted Head and Shoulders has a bullish potential outlook.
Technical Analysis Using Head and Shoulders
Now that we have discussed both the bullish and the bearish versions of the Head and Shoulders reversal pattern, I will now show you a couple of H&S trading examples as part of a technical analysis approach.
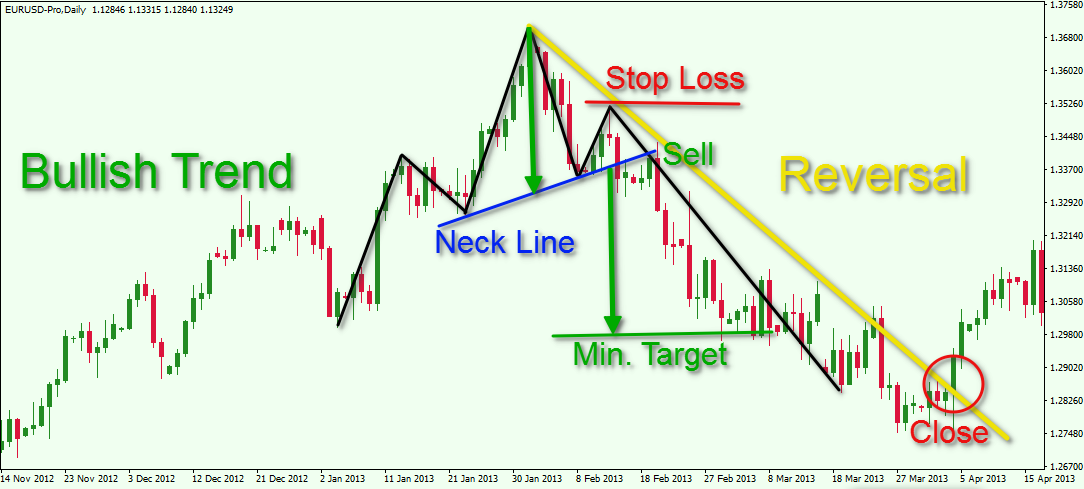
You are looking at the EUR/USD chart for Nov, 2012 – Apr, 2013. The image illustrates a Head and Shoulders trading example.
The chart starts with a bullish trend which lasts from November, 2012 to January, 2013. On the way up the price action creates a Head and Shoulders chart pattern. We have marked the figure with the black lines on the graph.
Since we have now identified the pattern, we will now draw in its neck line. This is the blue horizontal line on the chart. A short position could be opened in the EUR/USD when a candle closes below the blue neck line. Also, a stop loss order should be placed above the second shoulder of the pattern as shown on the image. The minimum target of the pattern is applied with the two green arrows. The minimum target equals the size of the pattern as we discussed earlier.
As you can see, the EUR/USD price enters a bearish trend after the pattern gets confirmed. Fourteen periods after the Head and Shoulders breakout, the price action completes the minimum potential of the pattern.
At this point you could either close out your entire position or decide to keep a portion of it open, to try to gain further momentum from the trade. If you decide to keep a small position open, you will want to take clues from the price action so that you can exit the remaining position in an informed manner.
The yellow bearish line on the chart is the trend line, which marks the bearish price action. The Head and Shoulders trade could be held as long as the price is located under the yellow trend. When the price closes a candle above the yellow trend line, the trade should be closed on the assumption that the bearish trend has been interrupted.
Let’s now turn our attention to another Head and Shoulders trading example:
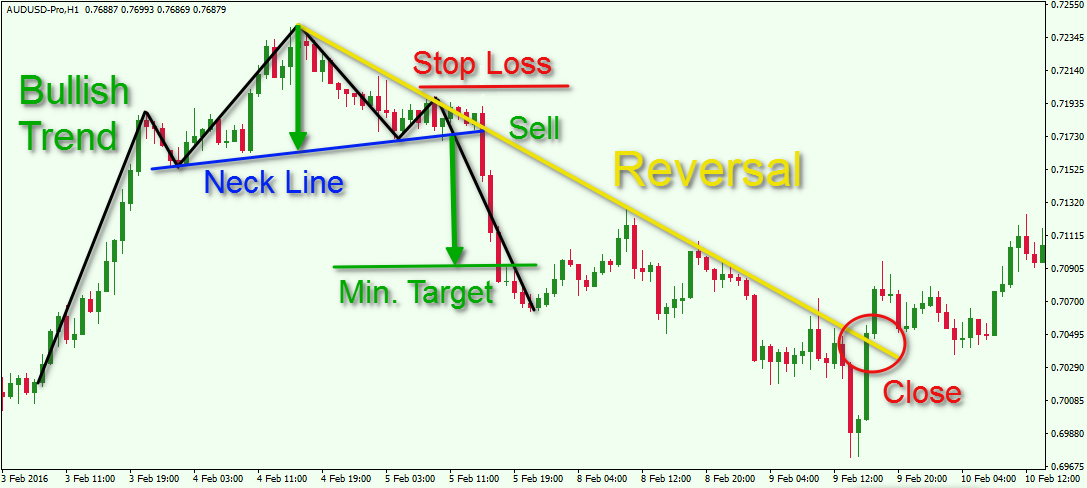
This is the H1 chart of the AUD/USD major currency pair for Feb 3 – Feb 10, 2016. The image shows another trading opportunity based on a Head and Shoulders chart pattern.
The H&S figure is illustrated with the black lines on the image. The blue line represents the neck line of the pattern, which goes through the two bottoms at the base of the head. The short trade should be opened when the price action breaches the blue neck line of the pattern. A stop loss should be placed above the second shoulder as shown on the image. Then the size of the pattern needs to be measured in order to attain the minimum potential price move. This is shown with the green arrows on the chart.
The price action enters a strong bearish trend after the short Head and Shoulders signal on the chart. I have outlined the bearish price move with a bearish trend line on the chart (yellow).
Although the price action completes the minimum target of the pattern in just three periods, the trade could be held further since the AUD/USD momentum was sharply downwards. This short Head and Shoulders trade could be held until the price action breaks the yellow bearish trend line in the bullish direction.
Inverted Head and Shoulders Trading Example
Let’s now look at a trading example of the Inverted Head and Shoulders setup. We will apply the same pattern rules we used for the Head and Shoulders pattern, but reversed.
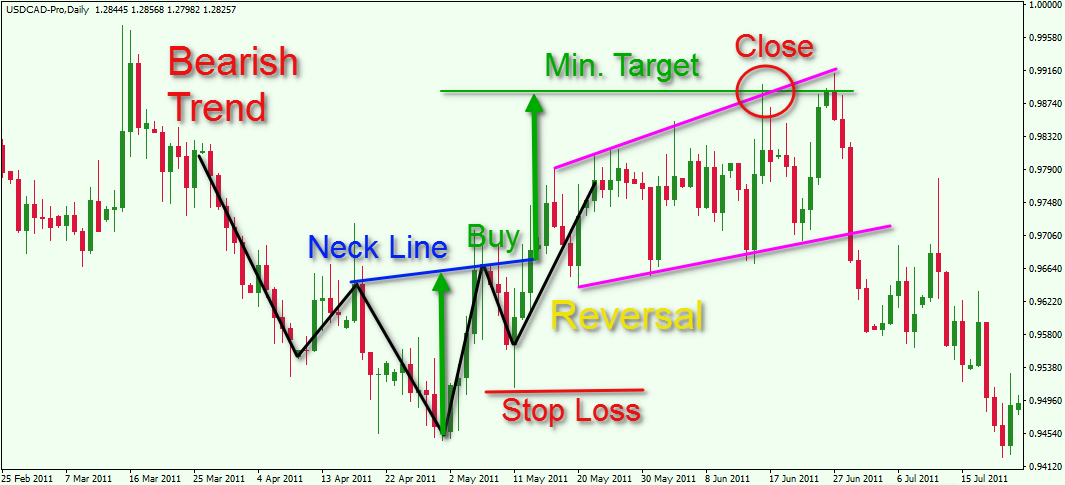
Here is the daily USD/CAD chart for Feb, 2011 – Jul, 2011. The black lines on the chart illustrate an inverted Head and Shoulders chart pattern.
Notice that the pattern comes after a bearish trend and reverses the price action. The blue line on the image is the neck line of the pattern. This time the neck connects tops and not bottoms, because the pattern is upside down. The USD/CAD pair could be bought when the price action closes a candle above the blue neck line. A stop loss should be placed under the second shoulder which forms the pattern.
Then you need to determine the size of the inverse Head and Shoulders pattern and to apply it upwards starting from the breakout through the neck line. This is illustrated by the green arrows on the chart.
The price starts increasing after the long signal on the chart. However, the price increase is not very sharp and it shows price hesitation. The pink lines on the image show that the price increase resembles a consolidation in the shape of a Rising Expanding Triangle. This type of triangle has a strong reversal potential. Therefore, the best option in this case would be to close the trade immediately upon reaching the minimum target of the inverted Head and Shoulders Pattern.
Download the short printable PDF version summarizing the key points of this lesson….Click Here to Download
Conclusion
Keys to Identifying and Trading the Head and
Shoulders Pattern
FOREX TRADING ARTICLES
Download the short printable PDF version summarizing the key points of this lesson….Click Here to Download
Head and Shoulders Pattern in Forex
The Head and Shoulders pattern is a chart figure which has a reversal character. As you might image, the name of the formation comes from the visual characteristic of the pattern – it appears in the form of two shoulders and a head in between. The pattern starts with the creation of a top on the chart. The price action then creates a second top, which is higher than the first top. A third top is created afterwards, but it is lower than the second top and is approximately at the same level as the first top.

The image above is a sketch of the Head and Shoulders chart pattern. The tops at (1), (2), and (3) create the three important swing points of the pattern.
- Top (1) corresponds to the first shoulder of the pattern.
- Top (2) is the “head” of the pattern.
- Top (3) corresponds to the second shoulder of the pattern.

Psychology of the H&S Technical Pattern
As I have mentioned, the Head and Shoulders formation is a reversal chart pattern. In this manner, the formation represents the loss of faith in the prevailing trend. The right shoulder on the chart which is lower than the head presents some important clues to the trader. The tops have been increasing initially until the creation of the third top (right shoulder). This decreasing top on the chart, represents the deceleration of the trend which is likely to lead to a trend reversal.
Head and Shoulders Pattern Rules
Let’s now discuss some trading rules surrounding the Head and Shoulders Pattern. After we go through these guidelines, you will be ready to start scanning for this pattern on your own price charts.
Drawing the Head and Shoulders Chart Pattern
The first important sign of an emerging Head and Shoulders reversal pattern comes from the bottom created after the head is formed. If you have and established trend on the chart, this bottom is likely to create a slowdown in the trend’s intensity. In many cases this bottom also creates a breakout from a bullish trend line.

This is the first indication of a reversal potential and an emerging Head and Shoulders reversal pattern on the chart. We have two tops which are increasing and correspond to the bullish trend. However, the bottom created after the head formation, typically breaks the trend line and ends near the same level as the previous bottom. This indicates that the bullish momentum is slowing.
After the head is completed, followed by a bottom outside the trend line, we should anticipate the third top, which will be lower than the head. Sometimes, during the formation of the right shoulder, price may test the already broken trendline as a resistance.

The creation of a third, lower top on the chart creates the H&S formation on the chart. However, this doesn’t mean that the pattern is confirmed. We will discuss how to confirm a valid Head and Shoulders pattern in the next section.
Head and Shoulders Neckline
The Head and Shoulders neckline is considered the most important component in trading the H&S pattern. The reason for this is that the H&S neckline acts as the trigger line for trading the pattern.
The neckline needs to be manually drawn on your chart. To draw the neckline, you need to locate two bottoms – the bottom just prior to the head formation, and the bottom just after the head formation. Then you should connect these two swing points with a line.

Learn What Works and What Doesn’t In the Forex Markets….Join My Free Newsletter Packed with Actionable Tips and Strategies To Get Your Trading Profitable…..Click Here to Join
Head and Shoulders Breakout
The Head and Shoulders breakout is the signal we need in order to open a short trade. To get a valid H&S breakout, we need to see the price action breaking through the neck line of the pattern. It is when a candle closes below the neckline, that a short signal is triggered for the Head and Shoulders setup.
Head and Shoulders Stop Loss
The Head and Shoulders trade setup should be used in conjunction with a stop loss order. Obviously, the H&S pattern, like any other pattern, does not provide a 100% success rate, so we must protect our trading account in case price moves against us.
The optimal place for your stop loss order is above the second shoulder on the chart. This corresponds to top (3). When you short the Forex pair after a Head and Shoulders breakout signal, you place the stop above the 3rd top of the pattern.
Head and Shoulders Price Target
The next question we must ask ourselves is “How long should we stay in the Head and Shoulders trade?” The answer to this question is a two-step process:
Measuring the Size of the Head and Shoulders Pattern
The size of the Head and Shoulders structure holds a direct relationship with the potential target for the trade. Therefore, it is paramount to understand how to measure the size of the H&S pattern. To do so, you need to take the distance between the tip of the head and the neck line. This will yield the size of the head and shoulders pattern.
Applying the Size of the Head and Shoulders Pattern
Now that you have the size of your H&S pattern on the chart, you should apply this length downwards, starting from the initial breakout through the neck line. This is the price move you should expect when trading the Head and Shoulders setup. In other words, the expected price move after the H&S pattern equals to the size of the pattern. This is often referred to by chart technicians as a measured move. Take a look at the diagram below:

So, as an option you can keep a portion of your position open beyond the minimum target. After all, if the price is trending in your favor, you may want to see if you can catch a runner. If you want to extend the target on the chart, you can do this by using simple price action rules or a trailing stop. Be on the lookout for important support and resistance levels, as well as trend lines, price channels, or reversal candles and chart patterns. Each of these might help you to determine your exit point on the chart.
Inverted Head and Shoulders Pattern
The Head and Shoulders pattern has its bullish equivalent. This is the inverted Head and Shoulders pattern. Contrary to the H&S pattern, the inverse H&S pattern appears during a bearish trend and it implies that the existing bearish tendency is likely to be reversed.
This pattern looks the same as the standard Head and Shoulders, but inverted. And so, the inverted Head and Shoulders pattern formation concerns bottoms, and not tops. This is how the inverted Head and Shoulders figure appears:

This sketch shows you that the inverse Head and Shoulders is an exact mirror replica of the Head and Shoulders pattern. Thus, the potential of the formation is reversed. The Head and Shoulders pattern has a bearish potential outlook, while the inverted Head and Shoulders has a bullish potential outlook.
Technical Analysis Using Head and Shoulders
Now that we have discussed both the bullish and the bearish versions of the Head and Shoulders reversal pattern, I will now show you a couple of H&S trading examples as part of a technical analysis approach.

You are looking at the EUR/USD chart for Nov, 2012 – Apr, 2013. The image illustrates a Head and Shoulders trading example.
The chart starts with a bullish trend which lasts from November, 2012 to January, 2013. On the way up the price action creates a Head and Shoulders chart pattern. We have marked the figure with the black lines on the graph.
Since we have now identified the pattern, we will now draw in its neck line. This is the blue horizontal line on the chart. A short position could be opened in the EUR/USD when a candle closes below the blue neck line. Also, a stop loss order should be placed above the second shoulder of the pattern as shown on the image. The minimum target of the pattern is applied with the two green arrows. The minimum target equals the size of the pattern as we discussed earlier.
As you can see, the EUR/USD price enters a bearish trend after the pattern gets confirmed. Fourteen periods after the Head and Shoulders breakout, the price action completes the minimum potential of the pattern.
At this point you could either close out your entire position or decide to keep a portion of it open, to try to gain further momentum from the trade. If you decide to keep a small position open, you will want to take clues from the price action so that you can exit the remaining position in an informed manner.
The yellow bearish line on the chart is the trend line, which marks the bearish price action. The Head and Shoulders trade could be held as long as the price is located under the yellow trend. When the price closes a candle above the yellow trend line, the trade should be closed on the assumption that the bearish trend has been interrupted.
Let’s now turn our attention to another Head and Shoulders trading example:

This is the H1 chart of the AUD/USD major currency pair for Feb 3 – Feb 10, 2016. The image shows another trading opportunity based on a Head and Shoulders chart pattern.
The H&S figure is illustrated with the black lines on the image. The blue line represents the neck line of the pattern, which goes through the two bottoms at the base of the head. The short trade should be opened when the price action breaches the blue neck line of the pattern. A stop loss should be placed above the second shoulder as shown on the image. Then the size of the pattern needs to be measured in order to attain the minimum potential price move. This is shown with the green arrows on the chart.
The price action enters a strong bearish trend after the short Head and Shoulders signal on the chart. I have outlined the bearish price move with a bearish trend line on the chart (yellow).
Although the price action completes the minimum target of the pattern in just three periods, the trade could be held further since the AUD/USD momentum was sharply downwards. This short Head and Shoulders trade could be held until the price action breaks the yellow bearish trend line in the bullish direction.
Inverted Head and Shoulders Trading Example
Let’s now look at a trading example of the Inverted Head and Shoulders setup. We will apply the same pattern rules we used for the Head and Shoulders pattern, but reversed.

Here is the daily USD/CAD chart for Feb, 2011 – Jul, 2011. The black lines on the chart illustrate an inverted Head and Shoulders chart pattern.
Notice that the pattern comes after a bearish trend and reverses the price action. The blue line on the image is the neck line of the pattern. This time the neck connects tops and not bottoms, because the pattern is upside down. The USD/CAD pair could be bought when the price action closes a candle above the blue neck line. A stop loss should be placed under the second shoulder which forms the pattern.
Then you need to determine the size of the inverse Head and Shoulders pattern and to apply it upwards starting from the breakout through the neck line. This is illustrated by the green arrows on the chart.
The price starts increasing after the long signal on the chart. However, the price increase is not very sharp and it shows price hesitation. The pink lines on the image show that the price increase resembles a consolidation in the shape of a Rising Expanding Triangle. This type of triangle has a strong reversal potential. Therefore, the best option in this case would be to close the trade immediately upon reaching the minimum target of the inverted Head and Shoulders Pattern.
Download the short printable PDF version summarizing the key points of this lesson….Click Here to Download
Conclusion
- The Head and Shoulders pattern is one of the most reliable chart patterns in Forex.
- It forms during a bullish trend and has the potential to reverse the uptrend.
- The name of the Head and Shoulders pattern comes from its visual structure – two tops with a higher top in between.
- The H&S pattern consists of three tops:
- The first top should be found in the context of a bullish trend.
- The second top should be higher than the first top.
- The third top should be lower than the second top and should be approximately on the same level as the first top.
- To trade the Head and Shoulders chart pattern you should apply the following rules:
- Identify a valid H&S pattern and draw each of the three tops that form the pattern.
- Apply a neck line through the two bottoms at the base of the head.
- Identify a Head and Shoulders breakout. Open a short trade when the price action breaks the neck line downwards.
- Put a stop loss above the second shoulder – the top prior the neck line breakout.
- Stay in the trade for a minimum price move equal to the size of the pattern – the distance between the tip of the head and the neck line.
- You can stay in you trade longer and use price action clues to exit, if you expect additional gains from your H&S trade.
- The Head and Shoulders chart pattern has its opposite equivalent – the inverse Head and Shoulders pattern.
- The inverted H&S pattern could be found during a bearish trend and it is expected to reverse the downtrend.
- The Inverse H&S pattern requires analyzing bottoms to confirm the formation.
- The neck line should go through the two tops that are immediately before and after the head formation.
- The stop loss order should be placed below the bottom, which corresponds to the second shoulder on the chart.
- Determine your price target using the Measured Move rule.
- النماذج .

المصدر و التفاصيل
http://forum.arabictrader.com/t176942.html
justice, 10 ابريل 2017تعديلحذفتبليـغ
#21أعجبنيرد

justiceActive Member
تكرار لمس الترند دليل ضعف

justice, 29 ابريل 2017تعديلحذفتبليـغ
#22أعجبنيرد

justiceActive Member
دبل بوتم
الاسهم السعودية402 × 296Search by image

ارقام210 × 193Search by image
---------------------------
آخر تعديل: 1 ديسمبر 2017
justice, 19 مايو 2017تعديلسجل التعديلاتحذفتبليـغ
#23أعجبنيرد

justiceActive Member
Arincen | ارينسن - كل ما يخص نموذج المثلث المتماثل وأقسامه
http://yallaforex.net/school-yallaforex-pages/42.htm
التحليل الفني
Analyzing Chart Patterns: Flags And Pennants
https://www.google.com/search?q=Ana...04M3XAhXRyKQKHTKYAzAQ_AUICigB&biw=800&bih=457
مختصر كتاب وموضوع نماذج وانماط الشارت - منتدى المتداول ...
ما الذي تعرفه عن الكوب والعروة
http://www.tdwl.net/vb/showthread.php?t=233426
https://www.google.com/search?q=نمو...FYPWgAbDjbfgCQ&start=10&sa=N&biw=800&bih=457
آخر تعديل: 24 فبراير 2018
justice, 9 نوفمبر 2017تعديلسجل التعديلاتحذفتبليـغ
#24أعجبنيرد

justiceActive Member
http://www.arabicbroker.com/forum/showthread.php?t=54437
justice, 8 ديسمبر 2017تعديلحذفتبليـغ
#25أعجبنيرد

justiceActive Member
نموذج الكوب والعروة
https://www.dailyfx.com/arabic/tadawul_forex_news/education/2016/09/25/Cup-and-Handle-Pattern.html
justice, 15 فبراير 2018تعديلحذفتبليـغ
#26أعجبنيرد

justiceActive Member
قاموس المصطلحات: كلمات مهمة في الفوركس | Royal Capital Pro
https://www.royalcapitalpro.com/ar/glossary
نقدم لكم شركة Royal Capital Pro أهم مصطلحات الفوركس ومصطلحات التداول وقاموس التداول، هذه المصطلحات تستخدم بشكل شائع في الأسواق المالية بشكل عام.
انواع النماذج السعرية - موقع أرباح الفوركس
https://arabic.pforex.com/trading-education/forex-school/شرح-نموذج-العلم/
www.fx-profit.net/vb/showthread.php?t=15662
07/06/2014 - سنتناول في هذا الموضوع انواع النماذج السعرية اي بما معناه الاشكال التي غالبا يرسمها السعر على الشارت ونسبة تحققها عالية جدا تصل الى 85% لذلك من يحترف هذه الاشكال وينضبط في تطبيقها يحقق المراد طبعا النماذج كثيرة ولكن سنقوم بعرضها على شكل مشاركات مع توضيح وشرح لكل نموذج بالصور ان شاء الله تحقق ...
flag pattern
https://www.google.com/search?clien...0#imgdii=YiRzQh0jyJ_F2M:&imgrc=HpGx7SHh7idhuM:
مختصر كتاب وموضوع نماذج وانماط الشارت
http://forum.arabictrader.com/t90819.html
دعوه لنقاش مبادىء التحليل الفني (الكولونيل )
مواقع .. فيديو
https://www.indexsignal.com/community/threads/353093/

Double Top- Double Bottom
1.Double top
Double top is one of the most basic and easiest to recognize pattern in Technical Analysis. Its formation comprises of 2 tops with 1 trough in between. The level of 1 top should be in 5% range of the other top. The horizontal line drawn at the level of the trough is called neckline or Support line. A double Top is said to be complete only when Price breaks the support line, providing a perfect opportunity to sell. (Successful rate: 89%- studying of Bulkowski (2005)). It is common to see a pullback testing the support line then fall.

Let’s take a look at some real life examples:
+ Entry: Sell at the breakout point or wait for the pullback. However we recommend to at least commit some of your capital into selling the breakout as the pullback doesn’t happen all the time.
+ Stoploss level should be put right above the resistance line (above 2 tops)
+ Profit target should be 80%-100% the height of the pattern measuring from the neckline to the higher top.( Price should fall at least the height of the pattern measuring from the breakout point)


2. Double bottom
It is a reflection of double top. Its formation comprises of 2 troughs with 1 top in between. The level of 1 bottom should be in 5% range of the other bottom. The horizontal line drawn at the level of the top is called neckline or Resistance line. A double bottom is said to be complete only when Price breaks above the neckline, providing a perfect opportunity to buy. It is common to see a throwback testing the neckline then rally.

Trading this pattern:
+ Entry: Buy at the breakout or wait for the throwback. However we recommend to at least commit some of your capital into buying the breakout as the throwback doesn’t happen all the time.
+ Stoploss level should be put right below 2 bottoms
+ Profit target should be 80%-100% the height of the pattern measuring from the lower bottom to the neckline. ( Price should rally at least the height of the pattern measuring from the breakout point)


Spotting these kind of pattern in retrospect is easy. However, to recognize these patterns in real market condition would require some practice. Let’s open your chart and look for it

http://financialwhirlpool.com/index.php/technical-analysis/double-top-double-bottom
Whirlpool
Hey guest, welcome to FinancialWhirlpool! Sign up and become
===========
- بعض النمآذج السعريه العاكسة الاتجآه ؛ ؛
1_ نموذج القمه الثنائيه :
وهي عباره عن قمتين بإرتفاع واحد تقريبا تعكس الإتجاه الصاعد كما فى الشكل التوضيحى التالى ..

2_ نموذج القاع الثنائي :
وهي عبآره عن قاعين بنفس الإرتفاع تقريبا ويعكس الإتجاه الهابط كما فى الشكل التوضيحى التالى ..

3_الرأس والكتفين : وهو من أشهر النماذج الإنعكاسية وهو يعكس الإتجاه الصاعد كما أن نسبة نجاحه عالية جدا ..

4_ الرأس والكتفين المقلوب : وهو عكس النموذج السابق ونفسه طريقة عمله ونسبة نجاحه ممتازه يعكس الإتجاه الهابط

مع ملاحظة ان إمتيآز النموذج رقم 3 وِِ 4 هو بتحديد الهدف المقصود بغض النظر عما سوف يحدث للسهم بعد تحقيق الهدف
مثال حي معــآصر على النموذج رقم 4 إليكم هذا الشآرت وتقبلو تحيــــآتي

بداية النموذج 10_3_2012 ونهايتــه في 24_4_2012 يعني شهر وعشرة أيآم تقريبآ ؛ ؛ وإليك الشآرت

منقول من http://tdwl.net/vb/showthread.php?t=318941
justice, 8 ديسمبر 2016تعديلحذفالآيبيتبليـغ
#16رد

justiceActive Member- هذه المشاركة قد تم حذفها جزئياً
الكوب والعروة
وهو أحد النماذج الاستمرارية التصحيحية الإيجابية والتي تتكون بعد ارتفاع للسهم
أي أنها تتكون خلال ترند صاعد وهي تمثل فترة استراحة للسهم يحدث بعدها اختراق
للأعلى.
How To Make Money . وقد اكتشف هذا النموذج ويليام أونيل وقد قدم فيكتابه
وفي هذا النموذج يكون هناكجزءان:
١- الكوب، ويتكون بعد ارتفاع للسهم ويظهر على شكل قاع دائري.
٢- العروة، ويتكون بعد أن يكتمل إنشاء الكوب ويكون في الجهة اليمنى للكوب
ويمكن أن تتخذ عدة أشكال مثل: نموذج رأس وكتفين ،نماذج مثلثات ، نموذج علم أو
على شكل عروة عادية.
4.jpg
نأتي لنصف شكل النموذج:
يحتوي على طرفين أو قمتين أيسر وأيمن وبعد الطرف الأيمن تتكون العروة.
الطرف الأيسر وتمثل بداية النموذج وتكون بسبب الارتفاع في سعر السهم بغرض
التصريف بعد حصول مرحلة من التجميع على السهم، والتي يبدأ السهم بعدها
بالانخفاض كتصحيح بنسبة تقارب ٥٠ % من الارتفاع الحاصل ويلاحظ تقلصمستوى
الكمية كلما اقترب السهم من القاع حتى يستقر السهم عند القاع لفترة وتتم عليه
هنا عملية تجميع يبدأ السهم بعدها بالارتفاع حتى يتكون الطرف الأيمن للكوب
ويكون مساوياً للطرف الأيسر أو أعلى منه ومن الملاحظات المهمة خلال هذا الارتفاع
ارتفاع مستوىكمية الأسهم المتداولة . وبعد تكون الطرف الأيمن يكون الكوب قد
اكتمل.
ونأتي الآن لمرحلة تكوين العروة والتي تكون أيضًا تصحيحاً للارتفاع الذي حصل
لتكوين الطرف الأيمن من الكوب.
٦ أشهر تقريباً، وأحياناً تكون أطول – المدة اللازمة لتكون هذا الكوب تمتد من ١
كما في الشارتات الأسبوعية، أما العروة فتستغرق مدة تكونها من أسبوع إلى عدة
٤ أسابيع تقريباً . - أسابيع وفي العادة تمتد من ١
السعر المستهدف من هذا النموذج هو المسافة بين قمة الطرف الأيمن وقاع الكوب
مضافة إلى قمة الطرف الأيمن.
من الأمور والملاحظات المهمة في تكون نموذج الكوب والعروة ما يلي:
أو قاع دائري لتكون نسبة تحققه " U " ١- من المفترض أن يكون الكوب على شكل
فنسبة تحققه تكون أقل من سابقه. " V " عالية . أما إن كان على شكل
٢- من المفترضأن يكون عمق الكوب تراجعاً تصحيحياً مقداره يتراوح بين ثلث إلى
نصف الترند الصاعد .
٣-كلماكان تراجع العروة صغيراًكلماكان إيجابياً أكثر.
٤- إذا تكونت العروة في مستوى أعلى من مستوى الطرف الأيسر فإن هذا سيكون من
أقوى نماذج الكوب والعروة إيجابية وأكثر تحقيقاً للهدف.
٥- نموذج الكوب والعروة الكامل يكون ذا طرفين متساويين
http://forex-masr.com/showthread.ph...وب-والعروة&s=0bdf2b7e0ebd12b170f548696604019d
Breakout Price Performance of Descending Triangle

Performance of the descending triangle is as follows (Kirkpatrick and Dahlquist, 2010, p. 315):
Price Breakout Up: Price fails to gain at least 5% from breakout only 7% of the time; the average maximum gain before any 20% decline is 47%.
Price Breakout Down: Price fails to gain at least 5% from breakout 16% of the time; the average maximum gain from shorting before any 20% reversal upwards is 16%.
Price Targets for the Descending Triangle Price Breakout
Bulkowski (2008) suggests the following breakout price targets for the descending triangle:
Descending Triangle Breakout Upward: Breakout Price + ((Highest Price in Triangle - Lowest Price in Triangle) * 84%)
Descending Triangle Breakout Downward:Lowest Price in Triangle - ((Highest Price in Triangle - Lowest Price in Triangle) * 54%)
http://www.finvids.com/Chart-Pattern/Triangles
=============
لكل من يستخدم Regression Channel
http://forum.arabictrader.com/t106725.html
=============
تعلم كيفية رسم القنوات السعرية في سوق الفوركس
في تعلیمالتاجات التداول- الفوركس- القناة السعرية- تداول فوركس- سوق الفوركس- فوركسيوليو 20, 2018386 مشاهدة
تعلم كيفية رسم القنوات السعرية في سوق الفوركس
القناة السعرية : هي خط متوازي يتم رسمه على الجانب الآخر لخط الاتجاه ، سواء كان الاتجاه صاعد أو هابط ويجب أن ترسم القنوات في نفس الوقت الذي رسمت فيه خط الاتجاه وبشرط التوازي التام.

أنواع القنوات :
(1) قناة صاعدة up channel
(2) قناة هابطة down channel
(3) قناة محصورة sideways channel
هذه الأداة متوفرة على برنامج الميتاتريدر.
يمكننا أن نختارها كما هو مبين في الصورة التالية ثم نرسم القناة على الشارت.

كيف يتم رسم القنوات
القناة السعرية الصاعدة :
بعدما ترسم ( خط الاتجاه الصاعد ) على مخطط العملة ارسم خط موازي لخط الاتجاه صاعد بحيث يكون ( فوق خط الاتجاه الصاعد بطريقة متوازية تماما ) ويرسم من خلال توصيل أعلى نقاط وصل إليها السعر في اتجاه صاعد بمعنى أخر وصل أقل نقطة سابقة بأعلى نقطة تالية فوق خط الاتجاه الصاعد.

القناة السعرية الهابطة :
عندما ترسم ( خط الاتجاه الهابط ) على مخطط العملة أرسم خط متوازي لخط الاتجاه الهابط بحيث يكون ( تحت خط الاتجاه الهابط بطريقة متوازية تماما ) ويرسم من خلال توصيل أقل نقاط وصل إليها السعر أثناء اتجاهه الهابط ، بمعنى أخر وصل أعلى نقطة سابقة بأقل نقطة تالية تحت خط الاتجاه الهابط.

قناة أفقية او عرضية :
عندما يتحرك السعر بشكل عرضي داخل منطقة أفقية للدعم والمقاومة، كما هو موضح أدناه، عندها يطلق عليها قناة أفقية.
كما توضح الصورة التالية

كيف نستخدم القنوات في المتاجرة :
عندما تضرب الأسعار خط الاتجاه السفلي للقناة الصاعدة ، فإن هذه المناطق قد تُستَعملُ كمنطقة شراء ، وعندما تضرب الأسعار خط الاتجاه العلوي للقناة الهابطة فإن هذه قد تُستَعملُ كمنطقة بيع.

http://buybitcoinforex.com/price_channels/
=============
5- نموذج المثلث
- نشر فى التحليل الفنى

رسم المثلثات triangles
المثلثات أكثر الأشكال التي يحدث تشكيلها كثيراً على المخططات وقد تعطي احتمال مبكرا عن إشارة عكس الاتجاه الحالي ( لفترة قصيرة ) وليس الاتجاه العام .
هذه المثلثات كثيراً ما تحدث وتعتبر مؤشراً مفيدة جدا لتجار التحليل التقني.
رسم المثلثات
رسم المثلثات على المخططات أساسا هو رسم كلا من خطي الدعم والمقاومة في وقت واحد فقط على أي مكان في المخطط ، سواء كان الاتجاه صاعد أو هابط وربما قد يكون هناك أكثر من مثلث مرسوم على المخطط الواحد.
أنواع المثلثات
(1) المثلث المائل ( المتماثل )
(2) مثلث قائم الزاوية ( صاعد )
(3) مثلث قائم الزاوية ( هابط )

(1) المثلث المائل Symmetrical triangles
فيه كل من خط الدعم وخط المقاومة يتقابلان ( أو يتقاربان عند نقطة واحدة ) وكلما اقترب السعر من نقطة المثلث كلما كان هناك توقع قريب بحدوث هروب في الأسعار إما لأعلى أو لأسفل.
يتكون هذا الشكل عندما تبدأ المستويات العالية للأسعار ومعها كذلك المستويات الأدنى في التقارب عند نقطة معينة واحدة.
لكن ما الذي يحدث أثناء تكون هذا الشكل !!
أسعار السوق تبدأ تصنع مستويات عالية منحدره لأسفل بشكل تدريجي ، وكذلك مستويات منخفضة مرتفعة لأعلى بشكل تدريجي ، والسبب هو ضيق مدى حركة زوج العملة وتوقف التجار عن المتاجرة بشكل تدريجي وتوقع كبير بأن أسعار السوق ستنفجر مرة واحدة بهروب السعر إما للاتجاه الأعلى أو للاتجاه الأسفل ، لأن التجارة سيفوز بها طرف من الطرفين ( المشترين أو البائعين ) لأنهم يدخلون التجارة دفعة واحدة بكل قوتهم.
بالنسبة لنا كمحللين تقنيون :
نحن ننتظر ( breakout هروب السعر ) مثل التجار أما أن نشتري أو نبيع حسب اتجاه الهروب.


في هذا المثال إذا وضعنا أوامر بيع فوق المنحدر في المستويات العالية المنحدره لأسفل ، فإننا قد ملكنا مجموعة من صفقات البيع التي ربما تحقق مكاسب هائلة ، وإذا وضعنا طلبات شراء على المستويات الأدنى التي ترتفع لأعلى ، وكان خطأ مثلا فيمكننا أن نلغيها ونسير مع اتجاه الصفقات المربحة فقط.
(2) مثلث قائم الزاوية ( صاعد ) Ascending Triangles
هو مشابه للمثلثات المائلة ولكن الفرق أن ( خط المقاومة ) المرسوم عبارة عن خط أفقي مرسوم بشكل مثالي بدون أي ميل فيه ، وهذه المثلثات القائمة من المحتمل أن تكون أكثر دقة من غيرها لأنها تعطي إشارة قوية حيث لأي جهة سيسلك السعـر طريقه.
هذا النوع من الأشكال يحدث عندما يكون هناك مستوى مقاومة وهناك المستويات الأدنى ترتفع لأعلى ، إذا ماذا يحدث أثناء هذا الوقت ... هناك شعور أكيد بأن المشترون ضعفاء ولكن بالرغم من ذلك إلا أنهم يدفعون بالسعر لأعلى كما هو واضح من قبل المستويات الأدنى التي ترتفع لأعلى.


كما ترى في المخطط بالأعلى أن قوة المشترين بدأت تزداد وذلك لأنهم صنعوا مستويات أدنى بشكل تدريجي مرتفع لأعلى مع الاحتفاظ بمستويات دعم بشكل تدريجي لأعلى وكذلك بدأ الضغط على مستوى المقاومة بشدة ، هذا يعطينا إشارة إلى احتمال كسر المقاومة أو ربما تتماسك المقاومة بشدة أمام الضغط .
سترى الكثير والكثير من الكتب حول شرح المخططات تقول لك أن المقاومة سيتم كسرها ، ولكن بناء على التجارب الشخصية فإنه ربما تكون القوة الشرائية لم تصل إلى الحد الكافي لكسر هذه المقاومة من أول مرة ، على أية حال هيا نرى في مثلنا ما الذي حدث.

في هذه الحالة كسب المشترين المعركة وراح السعر في طريقه للارتفاع بقوة لأعلى.
مرة أخرى : الحذر مطلوب عـند استعمال المثلثات لأنه قد تعطي إشارات خطا .
(3) المثلث قائم الزاوية ( الهابط ) Descending Triangles
هو مشابه للمثلثات المائلة ولكن الفرق أن ( خط الدعم ) المرسوم عبارة عن خط أفقي مرسوم بشكل مثالي بدون أي ميل فيه.
من المؤكد أنك مسرور الآن لأنك بدأت تشعر بالمتعة مع هذا الدرس الممتع السهل ... حسنا
إن المثلثات الهابطة بالطبع هي عكس المثلثات الصاعدة فهنا نرى خط مرسوم على طول المستويات العالية المنحدره لأسفل بشكل تدريجي والذي هو بمثابة خط المقاومة ويمثل ضغط البائعين لدفع الأسعار لأسفل ، على الجانب الأخر رسمنا خط تحت على طول المستويات الأدنى والتي تمثل الدعم أي ( قوة المشترين ).

في المخطط السابق ترى أن البيع أقوى بكثير وذلك لأن المقاومة تقوى وتأخذ شكل منحدر لأسفل ، أما المشترين يواجهون الضغط عليهم وربما يحدث ضعف وانهيار لمستوى الدعم الخاص بهم ، ولكن على أي حال نحن غير متأكدين

أين السعر سيذهب ، ولكن إذا شعرنا بأنه ذاهب إلى اتجاه هابط في هذه الحالة فيجب أن نضع أوامر البيع فوق على الخط الأعلى ( على المستويات العالية المنحدره لأسفل ) وتحت خط الدعم .

في هذه الحالة ، السعر انتهى بكسر الدعم وذهب في طريقه لأسفل بسرعة جدا.
لاحظ إن السوق تميل إلى الهبوط أسرع من الارتفاع هذا يجعلك تفكر بمكاسب سريعة إذا كنت تاجر من تجار المدى القصير ممكن يرغبون بالدخول بالصفقات السريعة والخروج منها بربح عالي.
(4) الأعلام والأوتاد Flags / Pennants / Wedges
تتكون سواء في الاتجاهات الصاعدة أو الهابطة وتشير إلى أن السوق يُقيِّمُ لحظة سعـر العملة أَو ببساطة ( نسميها مرحلة التقاط الأنفاس ).
رسم الأعلام على المخطط :
يتم رسم ذلك الشكل على المخطط عن طريق رسم كل من خطوط الدعم وخطوط الاتجاه بطريقة سهلة جدا ، عندما يتم رسمهم يجب أن يكون الرسم يدل على أسمه عند ظهوره على المخطط .
بمعنى آخر : أن يظهر العلم بشكل علم وأن يظهر الوتد بشكل الوتد.
إذا العلم أو العلم المثلث أو الأوتاد تشكلت فوق أو تحت الخطوط ، فإن الاتجاه عادة سوف يستمر في نفس الطريق ، وبمعنى آخر : التكوين فوق الاتجاه يستمر فوق ، وتحت الاتجاه يستمر تحت .

إذا أنت مسكت سعر في صفقة عند ( نقطة معينة ) وواحد من هذه الأشكال تكوًّن على المخطط فذلك إشارة للحذر بأنه سيتم اختراق إما خط الدعم أو خط الاتجاه ، لذلك يجب أن تتصرف بحرص.
==================
ملاحظة : مثلث صاعد داخل قناة صاعد ة ...............النتيجة نزول
مثلث هابط داخل قناة هابطة ...............النتيجة صعود
================
Principles of Technical Analysis: The Cup-and-Handle Pattern
July 22, 2010, 06:17:00 PM EDT By Melvin Pasternak, Investing Answers
consolidation , followed by a breakout. Once the pattern is complete, the stock should continue to trade upward, in the direction it was previously heading.
You can spot the pattern by looking for two main parts: the cup and the handle.
Within the cup, there are three components: the left side, bottom, and right side.
The left side of the cup is marked by a downward sloping arch. This part of the pattern represents the stock's temporary pullback. The pullback occurs because as the stock tests old highs, selling pressure increases. The bulls want to protect their profits. The bears want to push the stock price down. Ultimately, the bears win out. As the stock falls, trading volume tends to decrease.
The bottom of the cup is marked by a narrow trading range, or horizontal consolidation. Increased selling pressure creates a tug of war between the bulls and bears. The bulls are trying to protect their remaining profits. The bears want the stock to go down further.
This trading activity generally shows as a slight dip on the chart, or a rounded bottom. Volume is typically light. The sideways-like trading activity may last for approximately four days to one month. The longer and more pronounced the cup bottom, the stronger the buy signal once the final pattern has formed. However, cups with very deep bottoms or "V" shapes show sharp reversals and should likely be avoided. The ideal cup bottom is one-third the height of the previous advance.
The right side of the cup is the upward sloping arch, which indicates the stock's reversal back to the upside. At this point, the bulls have largely regained control. Volume generally increases as the stock moves back toward its old high. It can take a little as a month and a half for this part of the pattern to form. The more even the highs on both sides of the cup, the more reliable the pattern.
The handle always forms off the right side of the cup. It signifies that a small pullback occurred before the stock's ultimate rally. The handle may be marked by a pennant-like shape). The handle should, ideally, retrace one-third, or less, the height of the cup's advance. The smaller the retracement , the more bullish the breakout is likely to be. The handle usually forms within one week to a month. As the stock breaks out above resistance marked by the handle, volume typically increases. A breakout from the handle likely signifies a continuation of the stock's rally.
To determine how high the stock is likely to go after it has broken out, you can apply the measuring principle for a cup-and-handle formation. To do so, subtract the distance from the right peak of the cup to the bottom of the cup. Then, add this difference to the breakout level. This final number is your price target.
The six-month weekly chart of this week's stock pick Altera (Nasdaq: ALTR) provides a good example of the cup-and-handle formation.
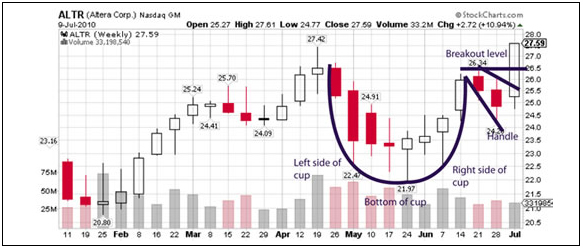
In mid-April of this year, shares of the chip company hit a 52-week high of $27.42. The stock then began to pull back. This pullback marked the left-side of the cup formation.
From May to June, ALTR consolidated, in an approximate $3 range between $21.97 and $24.91. The stock's May 24 low of $21.97 marked the dip, or bottom of the cup. Note the gentle "U" shape that forms from this trading activity. Trading volume was average.
In mid-June, shares gained some strength. The bulls appeared to have again seized control. As the stock rose, the right side of the cup formed. Note how the right side of the cup almost perfectly matches the left side.
The handle formed between June 21 and 28 as the stock pulled back slightly. Because the retracement of the handle was less than one-third of the cup, the resolution should be bullish.
During the following week the handle was bullishly broken. The stock surged nearly $3 and closed the week at a new recovery high.
Spot the cup and handle pattern and drink to your trading profits.
InvestingAnswers
The views and opinions expressed herein are the views and opinions of the author and do not necessarily reflect those of Nasdaq, Inc.
Read more: http://www.nasdaq.com/article/princ...he-cupandhandle-pattern-cm29628#ixzz4ZVRuccNq
================
الكوب والعروة Cub & Handle :
وهو أحد النماذج الاستمرارية التصحيحية الإيجابية والتي تتكون بعد ارتفاع للسهم أي أنها تتكون خلال ترند صاعد وهي تمثل فترة استراحة للسهم يحدث بعدها اختراق للأعلى .
وقد اكتشف هذا النموذج ويليام أونيل وقد قدم في كتابه How To Make Money .
وفي هذا النموذج يكون هناك جزءان :
1/ الكوب، ويتكون بعد ارتفاع للسهم ويظهر على شكل قاع دائري .
2/ العروة، ويتكون بعد أن يكتمل إنشاء الكوب ويكون في الجهة اليمنى للكوب ويمكن أن تتخذ عدة أشكال مثل: نموذج رأس وكتفين ،نماذج مثلثات ، نموذج علم أو على شكل عروة عادية .
نأتي لنصف شكل النموذج :
يحتوي على طرفين أو قمتين أيسر وأيمن وبعد الطرف الأيمن تتكون العروة.
الطرف الأيسر وتمثل بداية النموذج وتكون بسبب الارتفاع في سعر السهم بغرض التصريف بعد حصول مرحلة من التجميع على السهم، والتي يبدأ السهم بعدها بالانخفاض كتصحيح بنسبة تقارب 50% من الارتفاع الحاصل ويلاحظ تقلص مستوى الكمية كلما اقترب السهم من القاع حتى يستقر السهم عند القاع لفترة وتتم عليه هنا عملية تجميع يبدأ السهم بعدها بالارتفاع حتى يتكون الطرف الأيمن للكوب ويكون مساوياً للطرف الأيسر أو أعلى منه ومن الملاحظات المهمة خلال هذا الارتفاع ارتفاع مستوى كمية الأسهم المتداولة . وبعد تكون الطرف الأيمن يكون الكوب قد اكتمل .
ونأتي الآن لمرحلة تكوين العروة والتي تكون أيضاً تصحيحاً للارتفاع الذي حصل لتكوين الطرف الأيمن من الكوب .
المدة اللازمة لتكون هذا الكوب تمتد من 1 – 6 أشهر تقريباً، وأحياناً تكون أطول كما في الشارتات الأسبوعية، أما العروة فتستغرق مدة تكونها من أسبوع إلى عدة أسابيع وفي العادة تمتد من 1-4 أسابيع تقريباً .
السعر المستهدف من هذا النموذج هو المسافة بين قمة الطرف الأيمن وقاع الكوب مضافة إلى قمة الطرف الأيمن .
من الأمور والملاحظات المهمة في تكون نموذج الكوب والعروة ما يلي :
1/ من المفترض أن يكون الكوب على شكل " U " أو قاع دائري لتكون نسبة تحققه عالية . أما إن كان على شكل " V " فنسبة تحققه تكون أقل من سابقه .
2/ من المفترض أن يكون عمق الكوب تراجعاً تصحيحياً مقداره يتراوح بين ثلث إلى نصف الترند الصاعد .
3/ كلما كان تراجع العروة صغيراً كلما كان إيجابياً أكثر .
4/ إذا تكونت العروة في مستوى أعلى من مستوى الطرف الأيسر فإن هذا سيكون من أقوى نماذج الكوب والعروة إيجابية وأكثر تحقيقاً للهدف .
5/ نموذج الكوب والعروة الكامل يكون ذا طرفين متساويين .
وبالله التوفيق.................
الهدف السعري من نموذج الكوب والعروه يحسب بمعادلة حسابيه جدا بسيطه
وهي :
"" المسافة بين قمة الطرف الأيمن للكوب وقاع الكوب مضافة الى قمة الطرق الأيمن""
يعني بالمعادلات ///
اذا فرضنا
طرف الطرف الايمن للكوب = أ
قاع الكوب = ج
تصير المعادلة كألتالي :
الهدف السعري لتكون نموذج الكوب والعروه = ( أ - ج ) + أ
الأهداف السعريه هذه هي اهداف للشركه ان شاء الله يحققها السهم سعريا
" يعني اسعار للمستثمر وليس للمضارب "
سيان طلع السوق او نزل المؤشر فان شاء الله يصل له السهم ويحققه
منقووووووووووووووووول للفائده
الكاتب الاخ أوتارحساسة
http://www.qatarshares.com/vb/showt...A%D1%E6%E5-%DD%C7%E1%ED%DF%E3-%C7%E1%D4%D1%CD
=============
http://www.hawamer.com/vb/showthread.php?t=277613
نماذج المثلثات
=============================================================
Symmetrical triangles in uptrends are bullish, while symmetrical triangles in downtrends are bearish. For a bullish pattern, the first point (the point farthest left or the earliest) is at the top. For a bearish pattern, the first point is at the bottom.
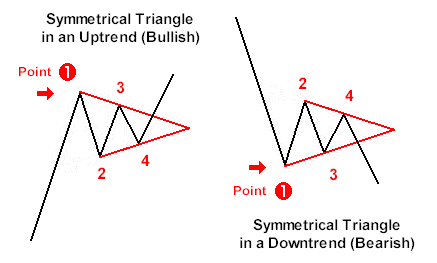
http://www.chartpatterns.com/cp_prs_user_manual.htm
==============
05-01-2007, 02:42 AM #1
ام عزام
محللة هوامير "رحمها الله"
تاريخ التسجيل: Aug 2005
المشاركات: 1,850
نماذج الشارت (2) المثلثات ( اولا : المثلث الصاعد )
السلام عليكم ورحمة الله وبركاته
اللهم علمنا ما ينفعنا ونفعنا مما علمتنا وزدنا علمنا
=========================
اتمنى من كل من يقرأ أن يدعو الله بالمغفرة لها ...وان يجازيها خير الجزاء على عملها الصالح هذا الذي نفع و سينفع كل يقرأه
http://www.hawamer.com/vb/showthread.php?t=277613
==========

Member Login
Bear Symmetrical Triangle
tothetick0 Comments
The Symmetrical Triangle as a price pattern is fairly common as it presents frequently in all markets, time frames, & price ranges and tends to provide a great reward-to-risk ratio when traded with a clear trend bias. Their versatility has made Symmetrical Triangles available as either a bullish or bearish trend continuation pattern or a reversal pattern depending on the trading environment in the background.
Visually the Symmetrical Triangle is characterized by a series of higher lows & lower highs. The shape of theSymmetrical Triangle is altered by the slope of the descending resistance line & the slope of the ascending support line which is ‘converging’ or; inclining toward each other.
Symmetrical Triangles vary in their duration & are often quite large which diminishes their momentum & represents indecision. They will have at least two swing highs and two swing lows in price. Traders should be prepared to adjust the trendlines as needed with additional swings. Volume usually diminishes as the pattern develops because traders become more & more unsure as to the market’s future direction. Symmetrical Triangles are considered neutral & often appear aimless in direction as the range-bound price action is balanced between buyers & sellers exhibiting similar strength. Eventually prices squeeze to an Apex. The closer to the apex price gets the odds for a break of the immediate price range become more likely.
Traders can look to trade the Symmetrical Triangle in numerous similar methods regardless of market environment but with several nuances can ‘stack the deck’ which increases the risk-to-reward ratio for profits. One of the best Symmetrical Triangle performers statistically is the bearish continuation pattern seen in a downtrend.
The bearish continuation pattern has 3 phases:
1) Background: A Strong impulsive, thrusting action with a surge in volume & price establishes a clear picture of the controlling bearish trend direction. In our symmetrical triangle price pattern it is represented visually by a Pole. Deeper and more drama the better as the Pole is the Key to recognizing the potential for the continuation of the pattern. The Pole represents trend direction as well as its strength & often this pattern is initiated as a new breakdown in price from an established area & sellers are in control.
2) The second phase is a pause for consolidation of the action both in volume & price and is represented by the symmetrical triangle. As traders we like to see this phase very short in duration with only 2 or 3 swings while our price action is range bound maintaining the higher lows & lower highs shape and the volume is ‘resting’. The best breakouts occur at 50-75% of the triangle completion. Caution if the breakout is delayed until prices crowd into the apex as it is an indication of ‘balance’ or indecision between buyers & sellers.
- regardless of trend direction a Symmetrical Triangle will have higher lows & lower highs & this description also applies to a Pennant price pattern.
- typically the difference between a Pennant & a Symmetrical Triangle is the size or duration of the consolidation phase. Pennants are usually shorter in duration & therefore 'stubby' in appearance.
Options for Trading the Symmetrical Triangle as a bearish continuation pattern:
There are two methods of trading this pattern and it depends on your trading style.
Aggressive traders will enter short trades right around the upper resistance trendline once sufficient resistance has confirmed. The concept is that the trend is on your side and the bears are maintaining a decreasing ‘wall of resistance’ while squeezing prices as evidenced by the slope of the immediate support line of the triangle.
This is a very accurate trade that usually has a great risk:reward ratio. Stop placement can be fairly tight right above resistance & can be adjusted downward accordingly. Note there is a ‘mid-line’ created using the apex as the measurement & traders can gauge success of the immediate swing based on this incremental value. When price approaches the advancing support line you should gauge the momentum: if you see that the momentum is strong stick to the position. However, if you see that support prevails, close the trade & take your profits to maximize the reward.
The aggressive trading method can highly increase the profit potential of any triangle, as you can trade the same pattern several times & profit from the ranging swing movements inside the pattern. However, remember that as a trend continuation pattern traders want this consolidation triangle formation to be relatively brief. Two or 3 swings may turn into more with this triangle but the 50-75% formation concept aids trade consideration.
Conservative traders will enter a trade once the lower ascending support line has been broken &/or the new breakdown has confirmed.
False breakouts do happen and confirmation needed is always a traders’ choice. Several methods that apply here for either intrabar &/or close bar options offered in sequence: breakdown below support price, retrace to breakdown price holds line, price clears breakdown swing low price, larger chart combination.
Stop placement considerations can be aggressively lowered after the breakdown of the price.
Measured Move Targets based on structure of Pole & the BearSymmetrical Triangle
Aggressive with Momentum & Volume: duplication of the original move or trader choice measurement of the Pole:
- Apex or BreakDown price (minus) Pole measure = target
- Pole measure = (Pole Base price (minus) Pole Tip price)
- Apex or BreakDown price (minus) Symmetrical Triangle measure = target
- Symmetrical Trianglemeasure = (swing high price triangle (minus)swing low price triangle)
Example Symmetrical Triangle as a bearish continuation pattern:


RELATED POSTS
https://www.tothetick.com/archives/2498
===========================================
https://www.google.com/imgres?imgurl=http://www.binarytribune.com/wp-content/uploads/2014/02/Symmetrical-Triangle-with-breakout-up.png&imgrefurl=http://www.binarytribune.com/forex-trading-academy/symmetrical-ascending-and-descending-triangles/&docid=hWIYLWluWOqtyM&tbnid=RT7QmKlBN_EKFM:&vet=10ahUKEwiUjfWHm9_SAhUEXBoKHdVhBsYQMwhAKBAwEA..i&w=630&h=357&client=opera&bih=459&biw=800&q=Symmetrical Triangle&ved=0ahUKEwiUjfWHm9_SAhUEXBoKHdVhBsYQMwhAKBAwEA&iact=mrc&uact=8
==================
نموذج المثلث الهلبط ....
الاصل أنه نموذج استمراري ... استثناء انعكاسي
قمم متنازله و خط دعم مستقيم
ترند هابط بصطدم بدعم ... فيسير افقيا ثم يضعف الدعم فيكسر هبوطا
ميل السوق هبوطي
==============
تموذج الماسة

www.finvids.com498 × 280Search by image
==============
https://www.google.com/search?q=Tre...olenSAhXKOhQKHU04ClkQ_AUICCgB&biw=800&bih=460
القنوات السعرية
=============
صور المثلث الصاعد ......
https://www.google.com/search?q=Asc..._AUICCgB&biw=800&bih=460#imgrc=emO5JUIY1MpUlM:
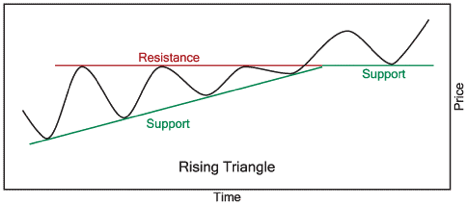
Ascending Triangle (Bullish) or Ascending Wedge (Very Not Bullish)?
StockCharts.com469 × 207Search by image
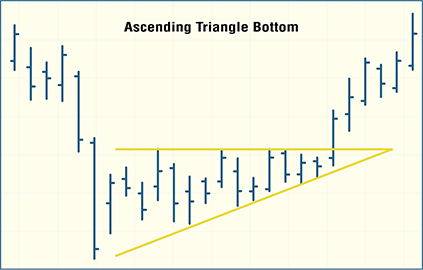
If the resistance line at the top of the pattern is horizontal and the support line underneath is rising, an Ascending Triangle pattern forms.
Visit page View image
..........
النماذج الفنية
http://www.arabictrader.com/ar/knowledge-base
============

http://www.thaibrokerforex.com/450-2/
http://www.finvids.com/Chart-Pattern/Triangles
التعديل الأخير بواسطة المشرف:
تطبيقات من تداولات السوق الكويتي
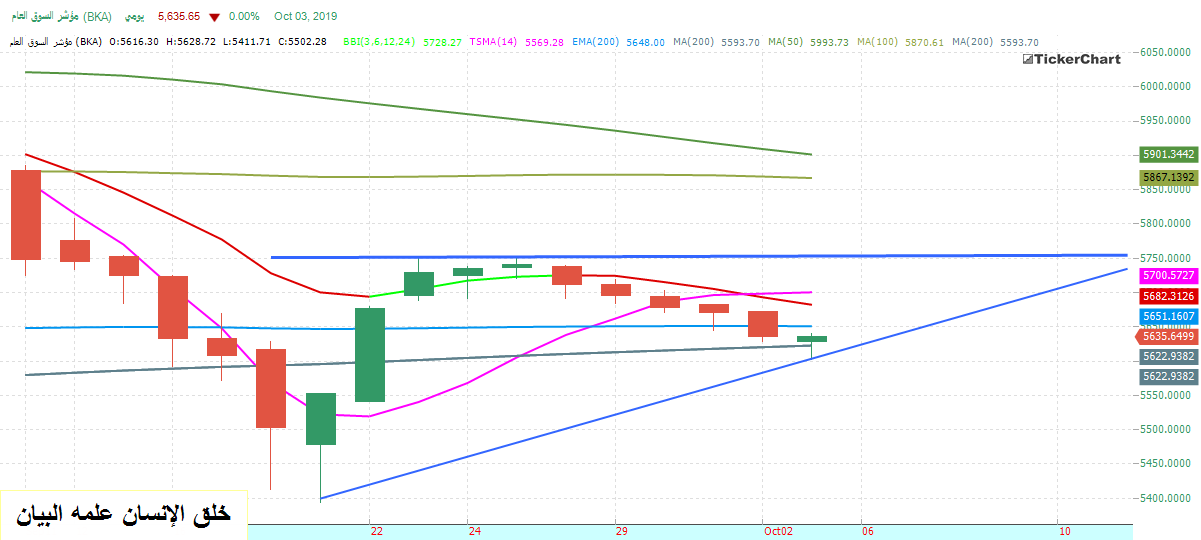
إقفال السوق الكويتي في 3 / 10
تشكل النموذج
رابط عالمي للنموذج https://www.google.com/search?q=asc...vYDlAhWIsRQKHROqAJ8Q_AUIEigB&biw=1163&bih=525

إقفال السوق الكويتي في 3 / 10
تشكل النموذج
رابط عالمي للنموذج https://www.google.com/search?q=asc...vYDlAhWIsRQKHROqAJ8Q_AUIEigB&biw=1163&bih=525
التعديل الأخير:
نموذج المثلث الهابط descending triangle
يعتبر هذا النمط او النموذج هو الصوره المنعكسه للمثلث الصاعد و يحمل نفس شروطه ألا انه فى النهايه نمط بيعى تصريفى يأتى بعد ترند هابط تصريفى و هو فى الغالب نمط أستمرارى الا انه فى بعض الأحيان ياتى على شكل نمط انعكاسى و هذا أذا أتى بعد ترند صاعد فغالبا ما يتم كسر هذا النموذج لأسفل من ناحيه الدعم .

شروط النموذج
1- ليس من المهم التركيز على حجم الترند الذى يسبقه و شكله و هذ بسبب ان هذا النموذج فى النهايه هو نموذج بيعى بغض النظر ان كان انعكاسى او أستمرارى .
2- ياتى الخط السفلى بشكل عرضى و يتم رسمه على قاعين على الأقل مع العلم ان القاعين يمكن ان لا ياتوا فى نفس المستوى و انهم يجب أن يكونوا متقاربين فى الحجم و الأرتفاع تقريبا و يجب ان يكون هناك مسافه بينهم جيده .
3- عامل الوقت مهم خصوصا فى الأسهم او بعض السلع فهو غالبا يأخذ بضع أشهر قبل ان يكتمل و غالبا ما تكون مده النموذج محصوره بين 3 أسابيع الى 3 شهور .
4- حجم التداول ينخفض كلما أستمر السعر داخل النموذج و غالبا ما يتحرك السعر بقوه ووسط حجم تداول عالى بعد الخروج من النموذج ألا انه بسبب ان هذا النموذج هو نموذج تصريفى فأن زياده حجم التداول عند الكسر ليس بالضرورى .
5- فى بعض الأحيان يحدث اعاده أختبار على الحافه العليا للمثلث قبل أن يكمل السعر اتجاهه لأعلى .
كيفيه حساب الهدف
و غالبا ما يتم حسابه عن طريق الطريقه العموديه و التى شرحناها من قبل
بمجرد الكسر يتم حساب أكثر منطقه مستعرضه فى المثلث ثم يتم طرحها من منطقه الكسر لحساب الهدف .

http://fx7days.com/school/viewarticle.aspx?id=1cf17a51-0846-42db-b26c-04b273648e88
يعتبر هذا النمط او النموذج هو الصوره المنعكسه للمثلث الصاعد و يحمل نفس شروطه ألا انه فى النهايه نمط بيعى تصريفى يأتى بعد ترند هابط تصريفى و هو فى الغالب نمط أستمرارى الا انه فى بعض الأحيان ياتى على شكل نمط انعكاسى و هذا أذا أتى بعد ترند صاعد فغالبا ما يتم كسر هذا النموذج لأسفل من ناحيه الدعم .

شروط النموذج
1- ليس من المهم التركيز على حجم الترند الذى يسبقه و شكله و هذ بسبب ان هذا النموذج فى النهايه هو نموذج بيعى بغض النظر ان كان انعكاسى او أستمرارى .
2- ياتى الخط السفلى بشكل عرضى و يتم رسمه على قاعين على الأقل مع العلم ان القاعين يمكن ان لا ياتوا فى نفس المستوى و انهم يجب أن يكونوا متقاربين فى الحجم و الأرتفاع تقريبا و يجب ان يكون هناك مسافه بينهم جيده .
3- عامل الوقت مهم خصوصا فى الأسهم او بعض السلع فهو غالبا يأخذ بضع أشهر قبل ان يكتمل و غالبا ما تكون مده النموذج محصوره بين 3 أسابيع الى 3 شهور .
4- حجم التداول ينخفض كلما أستمر السعر داخل النموذج و غالبا ما يتحرك السعر بقوه ووسط حجم تداول عالى بعد الخروج من النموذج ألا انه بسبب ان هذا النموذج هو نموذج تصريفى فأن زياده حجم التداول عند الكسر ليس بالضرورى .
5- فى بعض الأحيان يحدث اعاده أختبار على الحافه العليا للمثلث قبل أن يكمل السعر اتجاهه لأعلى .
كيفيه حساب الهدف
و غالبا ما يتم حسابه عن طريق الطريقه العموديه و التى شرحناها من قبل
بمجرد الكسر يتم حساب أكثر منطقه مستعرضه فى المثلث ثم يتم طرحها من منطقه الكسر لحساب الهدف .

http://fx7days.com/school/viewarticle.aspx?id=1cf17a51-0846-42db-b26c-04b273648e88

