تثبيت التطبيق
How to install the app on iOS
Follow along with the video below to see how to install our site as a web app on your home screen.
ملاحظة: This feature may not be available in some browsers.
أنت تستخدم أحد المتصفحات القديمة. قد لا يتم عرض هذا الموقع أو المواقع الأخرى بشكل صحيح.
يجب عليك ترقية متصفحك أو استخدام أحد المتصفحات البديلة.
يجب عليك ترقية متصفحك أو استخدام أحد المتصفحات البديلة.
مكتبة المؤشرات و النماذج ....
- بادئ الموضوع السيب
- تاريخ البدء
درس من السوق الكويتي
السهم أسيكو ....
الخميس
31/ 1 / 2019
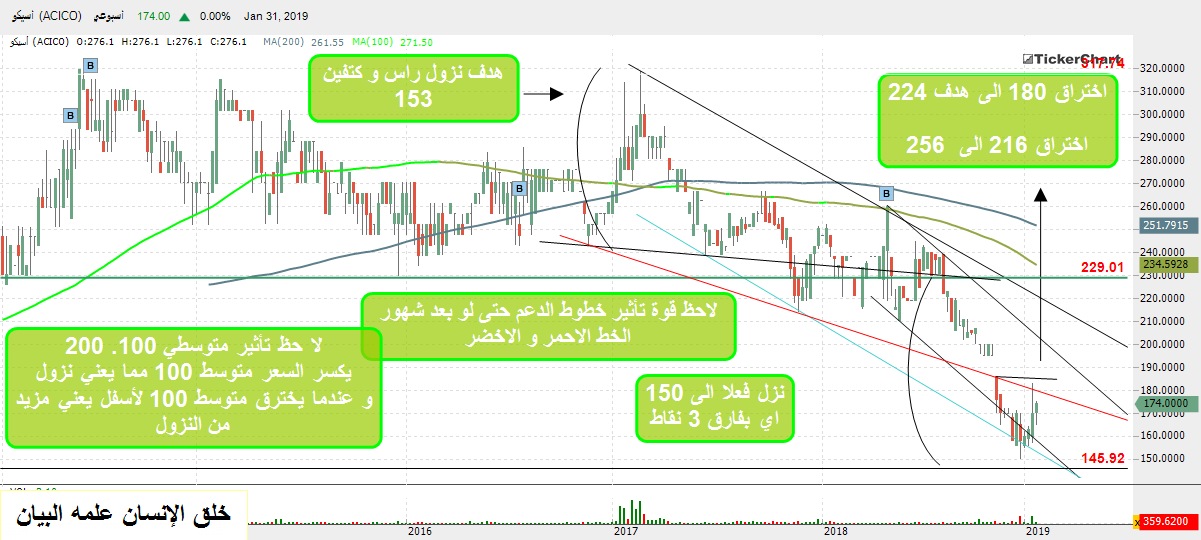
الشرح موجود على الشارت
و السهم بعد ان حقق هدف نموذج الراس و الكتفين ارتد
و هذا يبين مدى قوة النماذج في تحديد هدف نزل السهم و متى بعد سنتين في هذا السهم ..تخيل .. ان تعرف ان سهمك في طريقه للنزول من 234 الى 153 .. فتتصرف و تبيعه و تختار سهم آخر ... او تضارب فيه دون الاحتفاظ به
تخيل كم يحفظ لك النمووذج اموالك من ان تنهار امامك و تتبخر و انت تراها ...
السهم الآن في حالة ارتداد من 150 الى 180 .. و ان اخترق قناتين سوف يستهدف 256
و لاحظ انه كان اخترق لأسفل متوسطي 100 و 200 .. و الآن سوق يعود لإختراقهما لأعلى ........
..............
السهم أسيكو ....

الخميس
31/ 1 / 2019
الشرح موجود على الشارت
و السهم بعد ان حقق هدف نموذج الراس و الكتفين ارتد
و هذا يبين مدى قوة النماذج في تحديد هدف نزل السهم و متى بعد سنتين في هذا السهم ..تخيل .. ان تعرف ان سهمك في طريقه للنزول من 234 الى 153 .. فتتصرف و تبيعه و تختار سهم آخر ... او تضارب فيه دون الاحتفاظ به
تخيل كم يحفظ لك النمووذج اموالك من ان تنهار امامك و تتبخر و انت تراها ...
السهم الآن في حالة ارتداد من 150 الى 180 .. و ان اخترق قناتين سوف يستهدف 256
و لاحظ انه كان اخترق لأسفل متوسطي 100 و 200 .. و الآن سوق يعود لإختراقهما لأعلى ........
..............
التعديل الأخير:
شروط نموذج الكوب والعروة
اولا لازم نعرف ان نموذج الكوب والعروة لازم يتكون بعد ترند صاعد (هذا شرط)
يعني ما يصير كوب وعروة يتكون في ترند هابط
- المدة اللازمة لتكوين الكوب تمتد من شهر الى 6 اشهر .
- المدة اللازمة لتكوين العروة تمتد من اسبوع الى 4 اسابيع .
- غالبا تصحح العروة 40% من الكوب .
_ اذا تكون الكوب على شكل دائري فان نسبة تحققه تكون عاليه واذا تكون
على حرف 7 فان نسبة تحققه تكون اقل .
- بعد كسر المقاومة فان هدف النموذج وهو عمق الكوب لغاية قمة الكوب
نضيفها الى المقاومة لحساب الهدف .
من النقاط المهمه عند تكوين نموذج الكوب و العروه Cup & Handle
ان يكون الطرف الايمن للكوب اعلى او مساويا للطرف الايسر من الكوب
واللي واضح بالشارت ان الطرف الايسر اعلى من الطرف الايمن
لذلك السهم لم يشكل نموذج الكوب و العروه
منقول من https://www.indexsignal.com/community/threads/108003/
__________
::::::::::::::::::::::::::::::::::::::::::
ملاحظة مهمة :
لا يمكن القطع بدقة بالنسبة للشروط .. استمراري ... انعكاسي ... مدته ايام ..اسابيع .. شهور ..و غيره .. فمثلا حتى النموذج الانعكاسي .. قد يأتي استمراري .. فالأمر مرتبط بسوق و اسعار متحركة ..سريعة التغير ...
و برأي أن الشروط بمجملها قد تقربك اكثر نحو قوة تحقق النموذج ... و لكن يجب في الوقت نفسه الاخذ في الاعتبار ان الامر هو ارشادي .. عام .. و ان ابواب الاحتمالات مفتوحة نظرا لطبيعة حركة السوق ..و ان لا نضيع على انفسنا فرص الاستفادة من تشكل النموذج بالتشدد في تطبيق حرفي للشروط
و الحل هو في نظري هو بالنظرة العامة للنموذج .. و متابعة مدى امكانية تحققه من خلال الواقع .. فمدة تحقق نموذج الكوب و العروة قد تتراوح بين ايام و اسابيع و شهور و هذا يكفي كمؤشر انه ممكن ان يتشكل وفق اي زمن .. دون الدخول بتفاصيل اكثر ..
بل ان متداولي العملات يعتمدون عليه حين يتشكل خلال فترة دقائق ..
حكاية المتوسطات ........
الخط الاسود متوسط 200
الخط البيج متوسط 100
الخط الاخضر متوسط 50
شارت سهم بتروجلف ..........
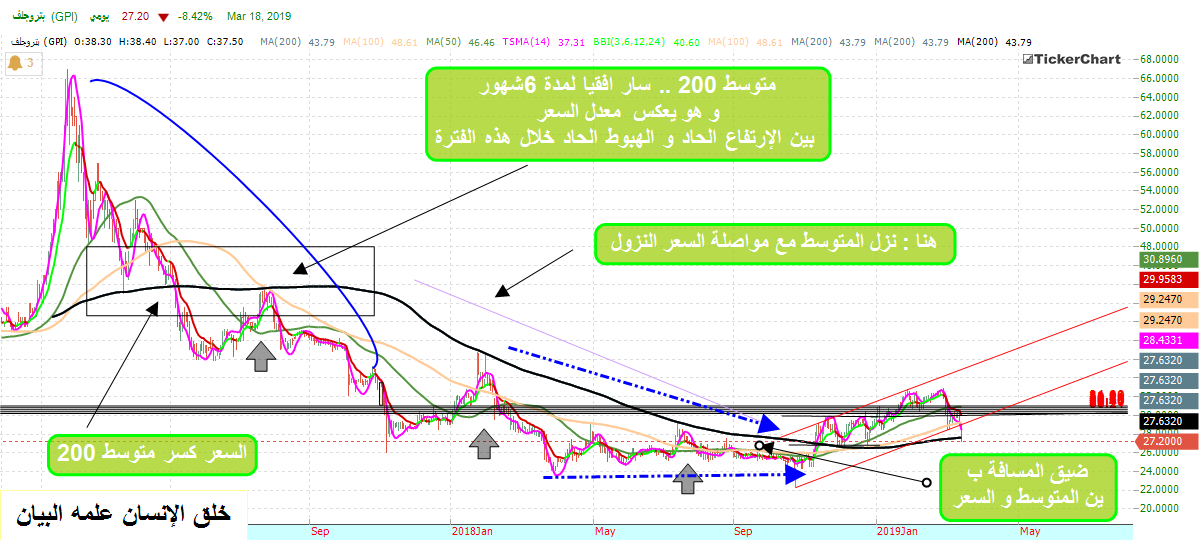
لاحظ متوسط 200 .. كيف سار افقيا لمدة 6 شهور .. و هو يعكس معدل السعر بين الإرتفاع الحاد و الهبوط الحاد خلال هذه الفترة .. و نخرج من هذا .. ان خط المتوسط 200 .. و نظرا لإنه يعكس السعر خلال فترة طويلة فإنه يسير بمسار مستقر لا تتخلله تذبذبات مهما تذبذب السعر ..
و لكن بعد أن هبط السعر اسفل من المتوسط .. نزل خط المتوسط بعدذلك ..ليش ؟ .. لأنه يعكس معدل اسعار هابطة متواصلة .. و نظرا لإن السعر لم يصعد اعلى من المتوسط .. فطبيعي انه لم يعد يعكس الا معدل اسعار هابطة .. فبالتالي بدأ ينزول مع السعر
طالع الشارت .. الاسهم تبين لك كيف ان السعر صعد و لامس متوسط 200 يوم و لكنه لم يخترقه
طيب شيفيدنا فيه هذا المتوسط ؟
هذا المتوسط يمكننا من معرفة مسار السهم على المدى الطويل ..
فالسعر عند 44 فلس كسر خط متوسط 200 بتاريخ 7 / 5 / 2017 .. و ظل يهبط لشهور طويلة الى ان صعد السعر في 12 / 11 / 2018 و اخترق متوسط 200 ..
و بعد ذلك مال المتوسط قليلا للأعلى ..
و لاحظ ان الاختراق تم بإرتفاع بسيط للسعر .. 3 فلوس فقط .. و يكاد يكون بحكم واقع التلامس بين السعر و متوسط 200 يوم .. كيف . ...
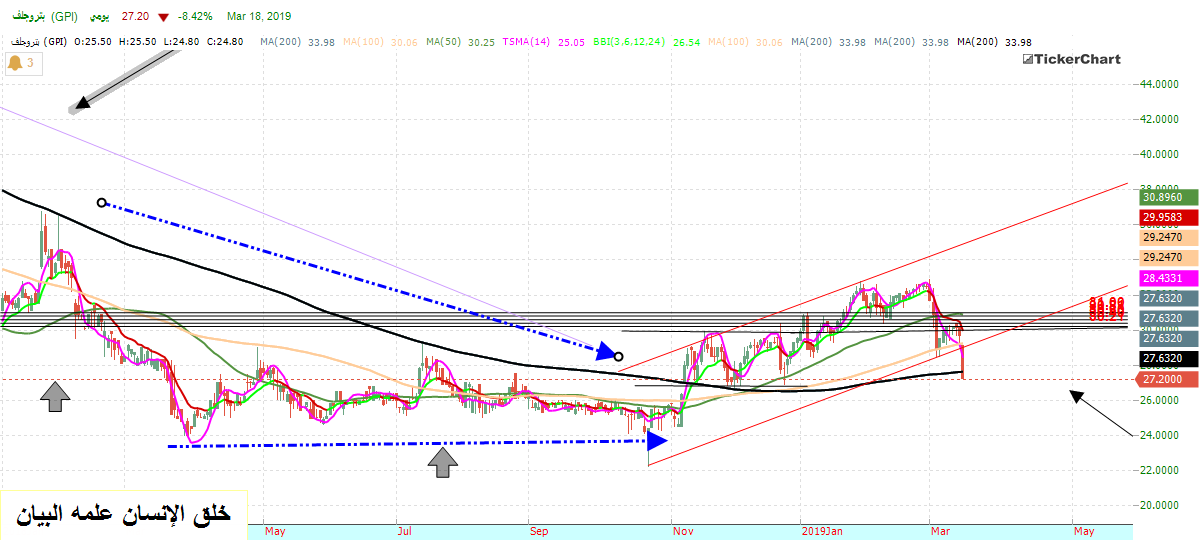
السعر من شهر 4 / 2018 بدأ يسير في نطاق افقي و نزوله بسيط جدا .. و المتوسط في هبوط .. فأضحى التلاقي بينهما حتمي مع مرور الوقت
الشارت التالي يبين لك ذلك
شيفيدني فيه هذا الاستنتاج ..
يفيدني في معرفة ان الصعود لن يكون قويا .. و ان الاختراق اتى ضمن نطاق تذبذب معتاد .. نعم قد تتغير كميات التداول و يزيد التذبذب .. و لكن لن يكون هناك زخم صعود او استمرارية ..
و هذا يتكرر في كثير من الاسهم الخاملة
اثناء التداول اليومي قد يبدو السهم و كأنه قد انطلق بعد خمول .. و ان اهدافه عالية .. يدعم ذلك كميات التداول العالية فيقبلون عليه .. ثم بعد ذلك يتراجع السعر .. فيبدو الامر و كأنه مصيدة
و هذا ما حدث مع سهم بتروجلف .. فلم يرتفع الا 3 او 4 فلوس .. و ظل يتذبذب بكميات كبيرة .. و تراجع فجأة ليعود ويكسر متوسط 200 و يقفل اسفل منه .. اي عاد الى نقطة البداية .. الى السلبية
اما بالنسبة لمتوسطي 50 .. 100 يوم فهما يسايران السعر صعودا و هبوطا .. الاقرب للسعر متوسط 50 .. ثم متوسط 100 ..ثم متوسط
و
و التغير في السعر سلبا يبدأ بكسر متوسط 50 يوم .. و يتأكد بكسر متوسط 100 .. و إن كسر متوسط 200 يكون قد دخل في نزول طويل زمنيا و سعريا .. و لكن بعض الاسهم يهتم صناع سوقها بالعودة لمسار فوق متوسط 200 .. وفقا لما يرونه مناسبا
و كذلك التغير في السعر ايجابا يبدأ بإختراق متوسط 50 يوم .. و يتأكد بإختراق متوسط 100 .. و إن إخترق متوسط 200 يكون قد دخل في ارتفاع طويل زمنيا و سعريا ..

الخط الاسود متوسط 200
الخط البيج متوسط 100
الخط الاخضر متوسط 50
شارت سهم بتروجلف ..........
لاحظ متوسط 200 .. كيف سار افقيا لمدة 6 شهور .. و هو يعكس معدل السعر بين الإرتفاع الحاد و الهبوط الحاد خلال هذه الفترة .. و نخرج من هذا .. ان خط المتوسط 200 .. و نظرا لإنه يعكس السعر خلال فترة طويلة فإنه يسير بمسار مستقر لا تتخلله تذبذبات مهما تذبذب السعر ..
و لكن بعد أن هبط السعر اسفل من المتوسط .. نزل خط المتوسط بعدذلك ..ليش ؟ .. لأنه يعكس معدل اسعار هابطة متواصلة .. و نظرا لإن السعر لم يصعد اعلى من المتوسط .. فطبيعي انه لم يعد يعكس الا معدل اسعار هابطة .. فبالتالي بدأ ينزول مع السعر
طالع الشارت .. الاسهم تبين لك كيف ان السعر صعد و لامس متوسط 200 يوم و لكنه لم يخترقه
طيب شيفيدنا فيه هذا المتوسط ؟
هذا المتوسط يمكننا من معرفة مسار السهم على المدى الطويل ..
فالسعر عند 44 فلس كسر خط متوسط 200 بتاريخ 7 / 5 / 2017 .. و ظل يهبط لشهور طويلة الى ان صعد السعر في 12 / 11 / 2018 و اخترق متوسط 200 ..
و بعد ذلك مال المتوسط قليلا للأعلى ..
و لاحظ ان الاختراق تم بإرتفاع بسيط للسعر .. 3 فلوس فقط .. و يكاد يكون بحكم واقع التلامس بين السعر و متوسط 200 يوم .. كيف . ...
السعر من شهر 4 / 2018 بدأ يسير في نطاق افقي و نزوله بسيط جدا .. و المتوسط في هبوط .. فأضحى التلاقي بينهما حتمي مع مرور الوقت
الشارت التالي يبين لك ذلك

شيفيدني فيه هذا الاستنتاج ..
يفيدني في معرفة ان الصعود لن يكون قويا .. و ان الاختراق اتى ضمن نطاق تذبذب معتاد .. نعم قد تتغير كميات التداول و يزيد التذبذب .. و لكن لن يكون هناك زخم صعود او استمرارية ..
و هذا يتكرر في كثير من الاسهم الخاملة
اثناء التداول اليومي قد يبدو السهم و كأنه قد انطلق بعد خمول .. و ان اهدافه عالية .. يدعم ذلك كميات التداول العالية فيقبلون عليه .. ثم بعد ذلك يتراجع السعر .. فيبدو الامر و كأنه مصيدة
و هذا ما حدث مع سهم بتروجلف .. فلم يرتفع الا 3 او 4 فلوس .. و ظل يتذبذب بكميات كبيرة .. و تراجع فجأة ليعود ويكسر متوسط 200 و يقفل اسفل منه .. اي عاد الى نقطة البداية .. الى السلبية
اما بالنسبة لمتوسطي 50 .. 100 يوم فهما يسايران السعر صعودا و هبوطا .. الاقرب للسعر متوسط 50 .. ثم متوسط 100 ..ثم متوسط
و
و التغير في السعر سلبا يبدأ بكسر متوسط 50 يوم .. و يتأكد بكسر متوسط 100 .. و إن كسر متوسط 200 يكون قد دخل في نزول طويل زمنيا و سعريا .. و لكن بعض الاسهم يهتم صناع سوقها بالعودة لمسار فوق متوسط 200 .. وفقا لما يرونه مناسبا
و كذلك التغير في السعر ايجابا يبدأ بإختراق متوسط 50 يوم .. و يتأكد بإختراق متوسط 100 .. و إن إخترق متوسط 200 يكون قد دخل في ارتفاع طويل زمنيا و سعريا ..
التعديل الأخير:
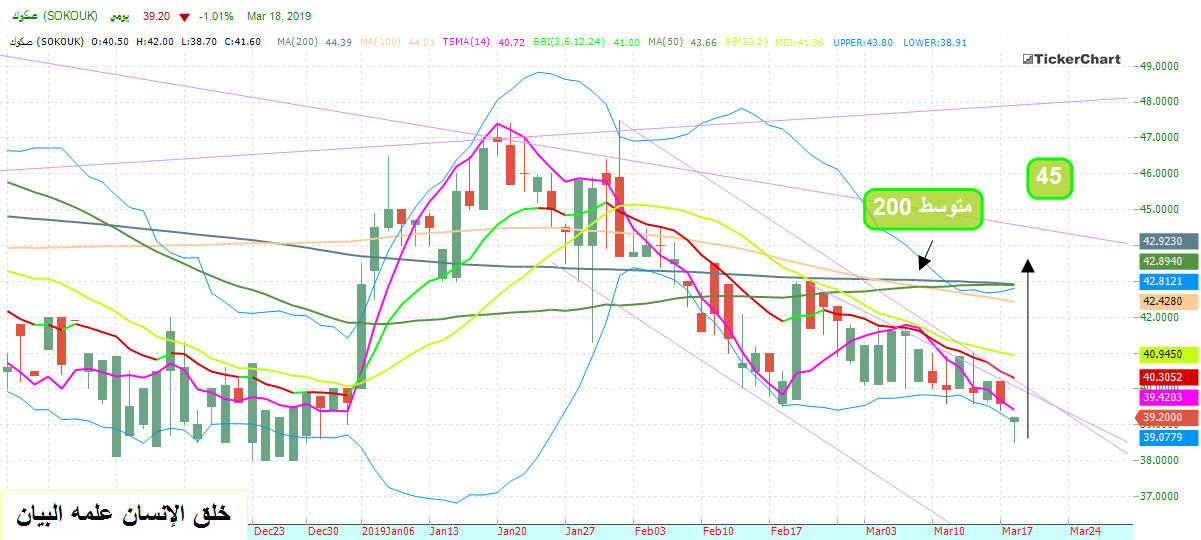
كما بينت اعلاه .. ان سهم بتروجلف عاد واقفل اسفل متوسط 200 عند 27.2 .. و دخل بالسلبية .. نتيجة ان اختراق متوسط 200 يوم لم يكن بزخم و قوة...و انما كان بحكم واقع الامر لإقتراب خطي السعر و متوسط 200 من بعضهما نتيجة خمول السهم
اليوم 18 / 3 .. هبط السهم .. و وصل الى ..الى 25.9 ........
و هذا خير مثال على ماورد من شرح في المشاركة السابقة اعلاه حول دور المتوسطات .. و ما توضحه من مسار السهم
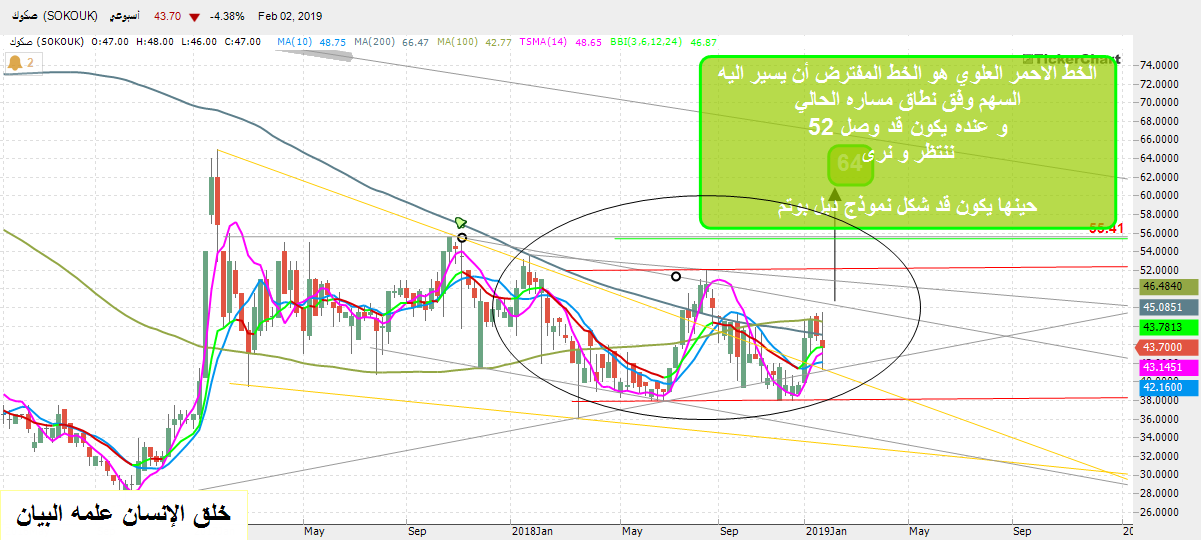
و هذا مثال لمسار سهم صكوك .. للمقارنة ..
السهم في موقع ارتداد .. و متوقع ان يخترق متوسط 200 ... و لكن بزخم .. لماذا ؟ ... لإنه لم يكن خاملا ..و بالتالي لن يكون الاختراق بحكم الامر الواقع .. و انما بتوجيه من صانع سوق السهم ...
و عليه فإن الاختراق متوقع ان يفتح له افق الصعود

#1
شرح عام عن المؤشرات باختصار ( اشارات شراء والبيع )
--------------------------------------------------
اخواني الكرام اضع لكم هذا الدرس حسب طلب الكثير من الأخوان واحب ان انوه لكم بأنه لا يصح الإعتماد على مؤشر واحد فقط ،، بل يتم الإعتماد على اكثر من مؤشر من اجل الحصول على قراءة صحيحة خالية من الإشارات الكاذبة او الخاطئة
مؤشر ستوكاستيك ( Stochastics )
- اشارة شراء = عندما مؤشر ستوكاستيك يهبط تحت 20 % ويصل إلى 5 % ثم يعود إلى الإرتفاع مرة اخرى إلى 20 %
- اشارة شراء = عندما يكون خط K % يقطع من اسفل إلى أعلى خط D %
- اشارة بيع = عندما مؤشر ستوكاستيك يصعد فوق 80 % ويصل إلى 95 % ثم يعود للهبوط مرة اخرى إلى 80 %
- اشارة بيع = عندما يكون خط K % يقطع من أعلى إلى اسفل خط D %
مؤشر التميت ( Ultimate )
- اشارة شراء = عندما مؤشر التميت يهبط تحت خط 30 ثم يرتفع مرة اخرى ويقطع خط 50
- اشارة بيع = عندما مؤشر التميت يصعد فوق خط 70 ثم يهبط مرة اخرى ويقطع خط 50
مؤشر ويليمز ( Williams % R )
- اشارة شراء = عندما يكون R % يقارب 90 % ( والسهم في ترند صعود )
- اشارة بيع = عندما يكون R % يقارب 10 % ( والسهم في ترند هبوط )
مؤشر القمم والقيعان ( Mumentum )
- اشارة شراء = عندما مؤشر مومنتوم يصعد للاعلى قاطعاً خط الصفر .
- اشارة بيع = عندما مؤشر مومنتوم يهبط للأسفل قاطعاً خط الصفر .
مؤشر MFI ( Money Flow Index )
- اشارة شراء = عندما مؤشر التدفق النقدي يكون هابطاً ثم يصعد للاعلى قاطعاً خط ال 20
- اشارة بيع = عندما مؤشر التدفق النقدي يكون صاعداً ثم يهبط للاسفل قاطعاً خط ال 80
مؤشر باربوليك سار ( Parabolic Sar )
- اشارة شراء = عندما مؤشر SAR ينتقل من أعلى السعر إلى اسفله
- اشارة بيع = عندما مؤشر SAR ينتقل من اسفل السعر إلى اعلاه
مؤشر قناة السعر ( Price Channel )
- اشارة شراء = عندما يلامس السهم الشريط السفلي لمؤشر قناة السعر ( دعم )
- اشارة بيع = عندما يلامس السهم الشريط العلوي لمؤشر قناة السعر ( مقاومة )
مؤشر القوة النسبية ( Relative Strength Index )
- اشارة شراء = عندما يقطع مؤشر القوة النسبية خط 30 هبوطاً ثم يغير اتجاهه ويصعد مخترقاً خط ال 30 صعوداً إلى الأعلى .
- اشارة بيع = عندما يقطع مؤشر القوة النسبية خط 70 صعوداُ ثم يغير اتجاهه ويهبط مخترقاً خط ال 70 هبوطاً إلى الأسفل .
مؤشرات المتوسطات المتحركة ( Moving Averages EMA . SMA )
( المتوسط الحسابي البسيط ) ( Simple MA )
- اشارة شراء = عندما مؤشر ( 5/20/50/100/200 ) SMA يصعد للأعلى ويقطع مؤشر السهم
- اشارة بيع = عندما مؤشر ( 5/20/50/100/200 ) SMA يهبط للأسفل ويقطع مؤشر السهم
( المتوسط الحسابي الأسي ) ( Exponential MA )
- اشارة شراء = عندما مؤشر ( 5/20/50/100/200 ) EMA يصعد للأعلى ويقطع مؤشر السهم
- اشارة بيع = عندما مؤشر ( 5/20/50/100/200 ) EMA يهبط للأسفل ويقطع مؤشر السهم
( تقاطع المتوسطات ) ( Simple MA )
- اشارة شراء = عندما مؤشر ( 4 ايام ) EMA يصعد للأعلى ويقطع مؤشر ( 9 ايام ) EMA
- اشارة شراء = عندما مؤشر ( 4 ايام ) EMA يصعد للأعلى ويقطع مؤشر ( 18 يوم ) EMA
- اشارة شراء = عندما مؤشر ( 5 ايام ) EMA يصعد للأعلى ويقطع مؤشر ( 13 يوم ) EMA
- اشارة شراء = عندما مؤشر ( 5 ايام ) EMA يصعد للأعلى ويقطع مؤشر ( 20 يوم ) EMA
- اشارة شراء = عندما مؤشر ( 50 يوم ) EMA يصعد للأعلى ويقطع مؤشر ( 200 يوم ) EMA
-------------------------------
- اشارة بيع = عندما جميع المؤشرات بالأعلى تتقاطع بنفس القيم ،، ولكن تهبط للأسفل مثال
- اشارة بيع = عندما مؤشر ( 4 ايام ) EMA يهبط للاسفل ويقطع مؤشر ( 9 ايام ) EMA وهكذا
( التقاطع الثلاث للمتوسطات المتحركة ) ( Triple Moving Averages Cross )
- اشارة شراء = عندما مؤشر ( 4 ايام ) EMA يصعد للأعلى ويقطع مؤشر ( 9 ايام ) EMA وبعد ذلك يقطع مؤشر ( 18 يوم ) EMA
- اشارة بيع = عندما مؤشر ( 4 ايام ) EMA يهبط للأسفل ويقطع مؤشر ( 9 ايام ) EMA وبعد ذلك يقطع مؤشر ( 18 يوم ) EMA
مؤشر بولينجر باندز ( Bollinger Bands )
- اشارة شراء = عندما يلامس مؤشر السهم الشريط السفلي لبولينجر باندز نستعد للشراء
- اشارة بيع = عندما يلامس مؤشر السهم الشريط العلوي لبولينجر باندز نستعد للبيع
- اشارة استعداد = عندما يضيق مؤشر البولينجر باندز على السهم ويكون السهم متذبذباً بينه ونتوقع صعوده او هبوطه ،، ونعرف الصعود والهبوط بالإستعانة ببعض المؤشرات مثل MFI و Macd وغيرها
مؤشر ( Demand Index ) ( DI )
- اشارة شراء = عندما يصعد مؤشر DI للأعلى قاطعاً خط الصفر
- اشارة بيع = عندما يهبط مؤشر DI للأسفل قاطعاً خط الصفر
مؤشر DMI ( Directional Movement Index )
- اشارة شراء = عندما DI+ يقطع DI- ويتجه إلى الأعلى
- اشارة بيع = عندما DI- يقطع DI+ ويتجه إلى الأعلى
يتم اضافة مؤشر ADX ( Average Directional Movement index ) لتأكيد قوة الترند
مؤشر الماكد ( Macd )
- اشارة شراء ( عندما يتقاطع الماكد مع خط الصفر صعوداً إلى المنطقة الموجبة فوق خط الصفر )
- اشارة شراء ( عندما يتقاطع الماكد مع خط اشارته صعوداً ويكون اعلى منه )
- اشارة بيع ( عندما يتقاطع الماكد مع خط الصفر هبوطاً إلى المنطقة السالبة تحت خط الصفر )
- اشارة بيع ( عندما يتقاطع الماكد مع خط اشارته هبوطاً ويكون ادنى منه )
مؤشر الشموع اليابانية ( Qstick )
- اشارة شراء = عندما يكسر مؤشر الشموع خط الصفر ويصعد إلى الأعلى
- اشارة بيع = عندما يكسر مؤشر الشموع خط الصفر ويهبط إلى الأسفل
تم جلبه للفائدة تحياتي للجميع
kuwait_17
https://www.indexsignal.com/community/threads/62820/
نموذج التماسك Consolidation

نموذج التماسك مشابه لنموذج الدعم والمقاومه وهو قادر على تحديد إتجاه السعر بعد الخروج من نموذج الدعم والمقاومه وغالباً يكون الإتجاه بعد الخروج من التماسك في نفس الإتجاه قبل الدخول في منطقة التماسك وبنفس طول الحركه قبل التماسك أي أن طول الحركه B سوف يساوي طول الحركه A
الشراء: عند تجاوز الحد العلوي من منطقة التماسك ( المقاومه )
الحد من الخساره: تحت مستوى الحد العلوي من منطقة التماسك
البيع: عند إرتفاع السعر بنفس المقدار قبل منطقة التماسك
مثال على نموذج التماسك

الشارت الموضح أعلاه لبنك الرياض خلال عام 2006 أو 2007 حيث تشكل نموذج تماسك واضح لمدة 3 شهور وكانت آخر حركه رأسيه للسعر قبل التماسك من عند النقطه 1 إلى النقطه 2 بطول 720 - 620 = 100 ريال ودخلت حركة السعر في تماسك بين النقطه 2 والنقطه 3 وبعد الخروج من التماسك يجب أن يتحرك السعر نفس الحركه قبل التماسك أي 100 ريال وإذا كان الحد الأعلى للتماسك عند النقطه 3 = 750 فيفترض أن يكون الهدف 750 + 100 = 850 ريال وهو ما حدث عند النقطه 4
لاحظ أن الإطار الزمني المستخدم في هذا التحليل هو اليومي وبالتالي يجب أن يتحقق الهدف ما بين أسبوع إلى شهر ومن خلال الشارت خرج السعر من التماسك خلال نهاية شهر أكتوبر وتم الوصول للهدف خلال منتصف شهر نوفمبر أي خلال أسبوعين ونسبة ربح 13%
http://www.indexsignal.com/community/pages/consolidation/
::::::::::::::::::::::::::::::::::::::::::::::::::::::::::
تطبيق على السوق الكويتي ..اقفال 24 / 3

إستطاع المؤشر العام اليوم تحقيق الهدف عند مستوى 5550 حسب التحليل الفني وبإستخدام أحد الأشكال الفنيه يطلق عليه
consolidation وهو أحد النماذج الفنيه المشهوره في علم التحليل الفني
x-ray
https://www.indexsignal.com/community/threads/372847/page-5#post-4681671

نموذج التماسك مشابه لنموذج الدعم والمقاومه وهو قادر على تحديد إتجاه السعر بعد الخروج من نموذج الدعم والمقاومه وغالباً يكون الإتجاه بعد الخروج من التماسك في نفس الإتجاه قبل الدخول في منطقة التماسك وبنفس طول الحركه قبل التماسك أي أن طول الحركه B سوف يساوي طول الحركه A
الشراء: عند تجاوز الحد العلوي من منطقة التماسك ( المقاومه )
الحد من الخساره: تحت مستوى الحد العلوي من منطقة التماسك
البيع: عند إرتفاع السعر بنفس المقدار قبل منطقة التماسك
مثال على نموذج التماسك

الشارت الموضح أعلاه لبنك الرياض خلال عام 2006 أو 2007 حيث تشكل نموذج تماسك واضح لمدة 3 شهور وكانت آخر حركه رأسيه للسعر قبل التماسك من عند النقطه 1 إلى النقطه 2 بطول 720 - 620 = 100 ريال ودخلت حركة السعر في تماسك بين النقطه 2 والنقطه 3 وبعد الخروج من التماسك يجب أن يتحرك السعر نفس الحركه قبل التماسك أي 100 ريال وإذا كان الحد الأعلى للتماسك عند النقطه 3 = 750 فيفترض أن يكون الهدف 750 + 100 = 850 ريال وهو ما حدث عند النقطه 4
لاحظ أن الإطار الزمني المستخدم في هذا التحليل هو اليومي وبالتالي يجب أن يتحقق الهدف ما بين أسبوع إلى شهر ومن خلال الشارت خرج السعر من التماسك خلال نهاية شهر أكتوبر وتم الوصول للهدف خلال منتصف شهر نوفمبر أي خلال أسبوعين ونسبة ربح 13%
http://www.indexsignal.com/community/pages/consolidation/
::::::::::::::::::::::::::::::::::::::::::::::::::::::::::
تطبيق على السوق الكويتي ..اقفال 24 / 3
إستطاع المؤشر العام اليوم تحقيق الهدف عند مستوى 5550 حسب التحليل الفني وبإستخدام أحد الأشكال الفنيه يطلق عليه
consolidation وهو أحد النماذج الفنيه المشهوره في علم التحليل الفني
x-ray
https://www.indexsignal.com/community/threads/372847/page-5#post-4681671

https://tradingsim.com/blog/bump-and-run/
متابعة للمشاركة اعلاه ..
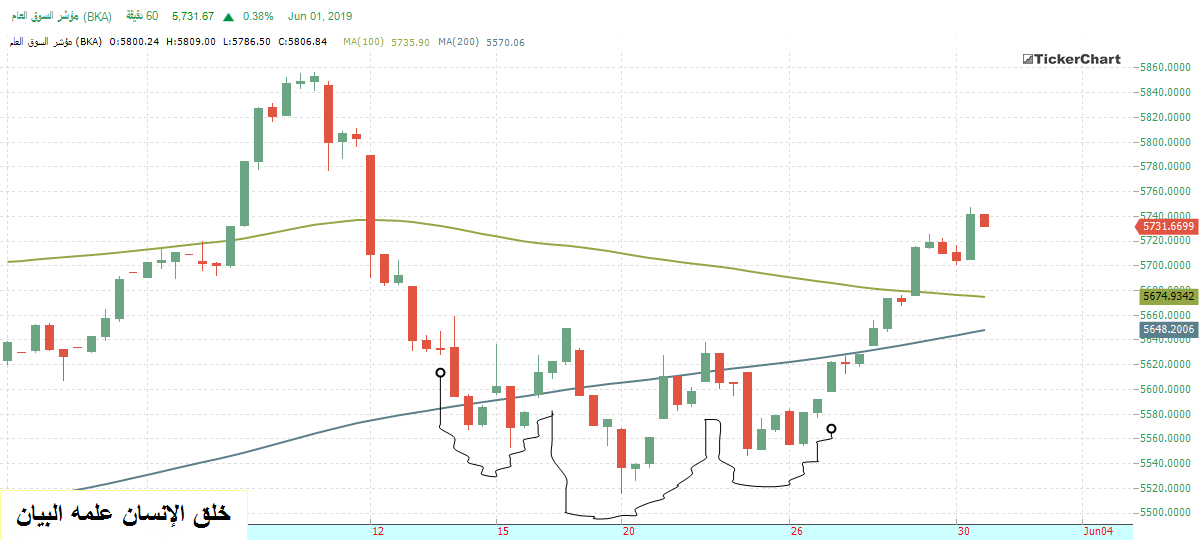
النموذج حقق هدفه 5739 ... ارتفاع 127 نقطة
التعديل الأخير:
نماذج الشارت - Chart Pattern
ماهي الجداول البيانية:What are Charts ?
جدول السعر يعبر عن تسلسل الأسعار برسم بياني في إطار زمني معين، وبعبارة إحصائية فإن الجداول البيانية يشار إليها برسوم بيانية متسلسلة زمنياً.
في الجدول البياني يمثل المحور الصادي " المحور العمودي " مقياس السعر ويمثل المحور السيني ( المحور الأفقي ) مقياس الزمن.

يقوم التقنيون والمحللون الفنيين وأخصائي الرسوم البيانية باستخدام الجداول البيانية لتحليل عدد كبير من السندات المالية والتنبؤ بحركات الأسعار المستقبلية، وتشير كلمة " سندات مالية " إلى أي أداة مالية قابلة للتجارة أو مؤشر قابل للقياس مثل الأسهم وسندات الدين والسلع وكل ما يشترى ويباع على أن يجري تسليمه في المستقبل أو مؤشرات السوق.
ويمكن استخدام أي سند مالي به بيانات سعريه على فترة زمنية لتكوين جدول بياني للتحليل.
وبما أن المحللين الفنيين يستخدمون الجداول البيانية على وجه الحصر إلا أن استخدام الجداول لا يقتصر عليهم فقط، وبما أن الجداول توفر قراءة سهلة للتمثيل البياني لحركة سعر السند المالي في فترة زمنية معينة فإنها يمكن أيضاً أن تكون ذات فائدة عظيمة للمحللين الأساسيين، كما أن السجل التاريخي البياني يسهل تحديد تأثير الأحداث الرئيسية على سعر السند المالي وأدائه في فترة زمنية وما إذا كانت تجارته قريبة من ارتفاعا ته وقريبة من انخفاضا ته أو في الوسط.
كيف تختار الإطار الزمني:How to Pick a Timeframe
الإطار الزمني المستخدم لتكوين الجدول البياني يعتمد على ضغط البيانات: وتكون البيانات، يومياً، أسبوعياً، ربع سنوية أو بيانات سنوية، وكلما قل ضغط البيانات كان عرض التفاصيل أكثر وضوحا.
البيانات اليومية يتم جمعها من المعطيات في اليوم والتي يكون قد تم ضغطها لإظهار كل يوم كنقطة بيانات فردية أو فترة.

اختيار ضغط البيانات والإطار الزمني يعتمد على البيانات المتوفرة وأسلوب الاستثمار:
* المستثمرون دائماً يركزون على الجداول التي تُجمع من البيانات اليومية للتنبؤ بحركات الأسعار قصيرة المدى، وكلما يكون الإطار الزمني أقصر والبيانات أقل ضغطاً تكون التفاصيل أكثر توفراً.
* المستثمرون دائماً يركزون على الجداول الأسبوعية واليومية لتحديد اتجاهات المدى الطويل والتنبؤ بحركات أسعار المدى الطويلة.
* الآخرون قد يستخدمون مجموعة مؤتلفة من جداول المدى الطويل والمدى القصير.
كيف يتم تكوين الجداول ؟ How are Charts Formed?
سنقوم بشرح تكوين Candlestick Chart & Bar Chart & Line Chart، وبالرغم من أن هناك طرق أخرى متاحة فإن هذه الثلاثة تعتبر من أكثر الطرق شعبية لعرض بيانات الأسعار.
جدول الخط:Line Chart
يعتبر جدول الخط من أبسط الجداول البيانية، حيث يتكون برسم نقطة سعر واحدة " عادة الإقفال" من السند المالي في فتره زمنيه.

بعض المستثمرون و المضاربين يعتبرون مستوى الإقفال أكثر أهمية من الافتتاح سوآ عاليا أو منخفضا، وبالانتباه إلى الإقفال فقط فإن التأرجحات يتم تجاهلها، وأيضاً تستخدم جداول الخط عند الافتتاح حيث لا تتوفر نقاط البيانات المرتفعة والمنخفضة.
جدول القضيب:Bar Chart
يكون جدول القضيب من أكثر الطرق رواجاً ويتطلب الارتفاع و الانخفاض والإغلاق لرسم السعر لكل فترة،
ويتم تمثيل الارتفاع و الانخفاض بأعلى وأسفل القضيب العمودي والإغلاق يمثله الخط الأفقي القصير الذي يقاطع القضيب الرأسي، في الجدول اليومي فأن كل قضيب يمثل الارتفاع و الانخفاض والإغلاق لنفس اليوم، وقد يكون للجداول ألأسبوعيه قضيب لكل أسبوع بناء علي إغلاق الخميس والارتفاع و الانخفاض لذلك الأسبوع.

ويمكن أيضاً أن يتم عرض الجداول القضيبية باستخدام الافتتاح والارتفاع والانخفاض والإغلاق، الفرق الوحيد هو إضافة سعر الافتتاح الذي تم عرضه كخط أفقي قصير يمتد إلى يسار القضيب. أما إذا ما كان جدول القضيب يشتمل أو لا يشتمل على الافتتاح فإن ذلك يعتمد على البيانات المتوفرة.

جدول عصى الشمعدان: Candlestick Chart
نشأت في اليابان منذ 300 عام مضت وقد أصبحت جداول عصى الشمعدان رائجة تماماً في السنوات الحالية، وبالنسبة لجدول عصى الشمعدان فإن الافتتاح والارتفاع والانخفاض والإغلاق تكون كلها مطلوبة. وتقوم عصى الشمعدان على أساس سعر الافتتاح والارتفاع والانخفاض والإغلاق في اليوم، أما عصى الشمعدان الأسبوعية فتقوم على أساس افتتاح يوم السبت ومدى الارتفاع والانخفاض الأسبوعي وإغلاق الخميس.
إن كثيراً من المضاربين والمستثمرين يعتقدون بأن جداول عصى الشمعدان تكون سهلة القراءة خاصة في العلاقة بين الافتتاح والإغلاق، وتتكون عصى الشمعدان البيضاء عندما يكون الإغلاق أعلى من الافتتاح بينما تتكون عصى الشمعدان السوداء عندما يكون الإغلاق أدنى من الافتتاح، القسم الأبيض والأسود المتكون من الفتح والغلق يطلق عليه لفظ الجسم " الجسم الأبيض أو الجسم الأسود " والخطوط الأعلى والأسفل يطلق عليها الظلال وتمثل الارتفاع والانخفاض.

قياس السعر rice Scaling
توجد هناك طريقتين لعرض مقياس السعر على المحور الصادي: حسابية ولوغاريثمية
المقياس الحسابي:
يعرض 10 نقاط "أو دولارات" كالبعد العمودي نفسه لا يهم مستوى السعر وكل وحدة قياس تكون هي نفسها في كل المقياس الكلي، فإذا تقدم السهم من 10 إلى 80 خلال فترة 6 أشهر فإن التحرك من 10 إلى 20 يبدو أنه يكون نفس المسافة كالتحرك من 70 إلى 80. حتى أن هذا التحرك يكون نفسه في الفترات المطلقة.
المقياس اللوغاريثمي:
يقيس تحركات السعر في فترات نسبة مئوية وقد يمثل التقدم من 10 إلى 20 زيادة 100%، والتقدم من 20 إلى 40 قد يكون أيضاً 100% كالتقدم من 40 إلى 80. وتبدو كل هذه الثلاثة كالبعد العمودي نفسه على المقياس اللوغاريثمي كما أن معظم برامج الجدولة ترجع إلى المقياس اللوغاريثمي كمقياس شبه لوغاريثمي لأن محور الزمن لا زال يتم عرضه حسابياً.

النقاط الأساسية لفوائد المقاييس الحسابية والشبه لوغاريثمية:
·المقاييس الحسـابية مفيدة عندما يكون مدى السعر مقتصراً على مدى ضيق نسبياً.
·يمكن أن تكون المقاييس الحسابية مفيدة لجداول الفترة القصيرة، ويتم توضيح تحركات الأسعار " خاصة للأسهم" بالدولار وتعكس تحركات دولار لدولار.
·تكون المقاييس شبه اللوغاريثمية مفيدة عندما يتحرك السعر بشكل بارز سواء في إطار زمني قصير أو ممتد.
·وتميل خطوط الاتجاه لتناسب الانخفاضات بشكل أفضل في المقاييس شبه اللوغاريثمية.
·يمكن أن تكون المقاييس شبه اللوغاريثمية مفيدة لجداول الفترة الطويلة لقياس تحركات النسبة المئوية خلال فترة طويلة من الزمن، وتوضع التحركات الواسعة في المنظور.
·ويتم الحكم على الأسهم وكثير من السندات المالية الأخرى بفترات نسبية خلال استخدام معدلات مثل PE والإيرادات / الأسعار ويوضع هذا في الاعتبار فإنه أيضاً يتم تحليل تحركات السعر في فترات نسبة مئوية.
مقدمه عن النماذج:Introduction to Chart Patterns
هناك مئات الألوف من المشاركين في السوق يشترون ويبيعون السندات المالية لمختلف الأسباب: مثل الأمل في الربح والخوف من الخسارة والضرائب والتغطية القصيرة والتغطية والتوقف من الخسارة واستهداف السعر والتحليل الأساسي والتحليل الفني وتوصيات السمسار وغيرها.
النماذج تضع الشراء والبيع في المنظور السليم بتوحيد قوى العرض والطلب في صورة موجزة كسجل صوري كامل لكل سهم فإن النماذج توفر إطار عمل لتحليل مدى المعركة بين الارتفاعات والانهيارات، والأكثر أهمية من ذلك فإن النماذج والتحليل الفني يمكن أن يساعدا في تحديد من يكسب المعركة مما يسمح للمضاربين والمستثمرين باتخاذ مواقعهم بناءً على ذلك.
ويمكن استخدام تحليل النموذج لعمل تنبؤات قصيرة المدى أو طويلة المدى، ويمكن أن تكون البيانات يومياً، أو أسبوعياً، أو شهرياً وقد تكون النماذج قصيرة كيوم واحد أو طويلة كسنوات والفجوات والانعكاسات الخارجية قد تتشكل في موسم تجاري واحد.

مجموعتين سائدتين:Tow Dominant Groups
المعتقدان الأساسيان في التحليل الفني هما: اتجاه الأسعار وأن التاريخ يعيد نفسه، الاتجاه الصاعد يشير إلى أن قوى الطلب " bulls " تحت السيطرة ويشير الاتجاه النازل على أن قوى العرض "bears" تحت السيطرةوبناءً على ذلك فإن الأسعار لا تتجه إلى الأبد وكلما ينتقل ميزان القوة يبدأ النموذج في البروز والانبثاق ولذلك فإن الغالبية العظمى من النماذج تقع في مجموعتين رئيسية: الانعكاسية والمستمرة
النماذج الأنعكاسيه: Reversal Patterns
تغير الاتجاه وأنه يمكن أن تنقسم على أشكال أعلى وأدنى.
النماذج المستمر ه:Continuation Patterns
فإنها تشير إلى التوقف في الاتجاه كما تشير إلى أن الاتجاه السابق سيبدأ بعد فترة زمنية.
أنواع النماذج الأنعكاسيه:Type Of Reversal Patterns
1- الوتد الصاعد ( نموذج انعكاسي )
Rising Wedge
الوتد الصاعد يمثل نموذج (هبوط) يبدأ واسع في الأسفل ويتقلص كلما تتحرك الأسعار إلى أعلى
يمكن أن يكون الوتد الصاعد واحد من أكثر النماذج صعوبة في التعرف عليه بدقة ومهارة، وبما أنه شكل متماسك إلا أن خسارة كمية التحرك إلى الجانب الأعلى في كل ارتفاع متتالي تعطي النموذج تحيزية الفظ، لذلك فإن سلاسل الارتفاعات الأعلى والانخفاضات الأعلى تحافظ على الاتجاه المتفائل، ويدل الارتفاع النهائي على أن قوى الطلب قد فازت أخيراً وبالمثل الأسعار الأقل، ولا توجد هناك تقنيات قياس لتقدير الانحدار ولذا فإنه يجب استخدام جوانب أخرى من التحليل الفني للتنبؤ بالأسعار المستهدفة.

2- الوتد الهابط ( انعكاسي )
Falling Wedge
الوتد الهابط يمثل نموذج bullish يبدأ عريض في القمة ويتقلص كلما تتحرك الأسعار إلى أدنى، وتشكل حركة السعر مخروطاً ينحدر إلى أسفل كلما تتقارب ارتفاعات وانخفاضات ردة الفعل كما أن الوتد الهابط يمكن أيضاً أن يلائم الفئة المستمرة، وكنموذج مستمر فإن الوتد الهابط لا يزال ينحدر إلى أسفل إلا أن الانحدار يكون عكس الاتجاه إلى أعلى السائد، وكنموذج انعكاسي فإن الوتد الهابط ينحدر إلى أسفل ومع الاتجاه السائد، وبدون اعتبار للنوع " انعكاسي أو مستمر " فإن الأوتاد الهابطة تعتبر كنماذج bullish.

وكما هو الحال مع الأوتاد الصاعدة فإن الوتد الهابط قد يكون واحد من أكثر النماذج صعوبة في معرفته بدقة، وعندما تتكون الارتفاعات الأدنى والانخفاضات الأدنى كما في حالة الوتد الهابط فإن السند المالي يبقى في اتجاه أسفل، ويصمم الوتد الهابط لتحديد الانخفاض في كمية التحرك إلى الجانب الأسفل وينبه الفنيين إلى الاتجاه المحتمل للانعكاس، وبالرغم من أن ضغط البيع قد يكون متلاشياً فإن الطلب لا يفوز حتى تنقطع المقاومة، كما هو الحال مع معظم النماذج فإنه يكون من المهم أن تنتظر الارتفاع وتجمع الجوانب الأخرى للتحليل الفني لكي تثبت الإشارات.
ماهي الجداول البيانية:What are Charts ?
جدول السعر يعبر عن تسلسل الأسعار برسم بياني في إطار زمني معين، وبعبارة إحصائية فإن الجداول البيانية يشار إليها برسوم بيانية متسلسلة زمنياً.
في الجدول البياني يمثل المحور الصادي " المحور العمودي " مقياس السعر ويمثل المحور السيني ( المحور الأفقي ) مقياس الزمن.

يقوم التقنيون والمحللون الفنيين وأخصائي الرسوم البيانية باستخدام الجداول البيانية لتحليل عدد كبير من السندات المالية والتنبؤ بحركات الأسعار المستقبلية، وتشير كلمة " سندات مالية " إلى أي أداة مالية قابلة للتجارة أو مؤشر قابل للقياس مثل الأسهم وسندات الدين والسلع وكل ما يشترى ويباع على أن يجري تسليمه في المستقبل أو مؤشرات السوق.
ويمكن استخدام أي سند مالي به بيانات سعريه على فترة زمنية لتكوين جدول بياني للتحليل.
وبما أن المحللين الفنيين يستخدمون الجداول البيانية على وجه الحصر إلا أن استخدام الجداول لا يقتصر عليهم فقط، وبما أن الجداول توفر قراءة سهلة للتمثيل البياني لحركة سعر السند المالي في فترة زمنية معينة فإنها يمكن أيضاً أن تكون ذات فائدة عظيمة للمحللين الأساسيين، كما أن السجل التاريخي البياني يسهل تحديد تأثير الأحداث الرئيسية على سعر السند المالي وأدائه في فترة زمنية وما إذا كانت تجارته قريبة من ارتفاعا ته وقريبة من انخفاضا ته أو في الوسط.
كيف تختار الإطار الزمني:How to Pick a Timeframe
الإطار الزمني المستخدم لتكوين الجدول البياني يعتمد على ضغط البيانات: وتكون البيانات، يومياً، أسبوعياً، ربع سنوية أو بيانات سنوية، وكلما قل ضغط البيانات كان عرض التفاصيل أكثر وضوحا.
البيانات اليومية يتم جمعها من المعطيات في اليوم والتي يكون قد تم ضغطها لإظهار كل يوم كنقطة بيانات فردية أو فترة.

اختيار ضغط البيانات والإطار الزمني يعتمد على البيانات المتوفرة وأسلوب الاستثمار:
* المستثمرون دائماً يركزون على الجداول التي تُجمع من البيانات اليومية للتنبؤ بحركات الأسعار قصيرة المدى، وكلما يكون الإطار الزمني أقصر والبيانات أقل ضغطاً تكون التفاصيل أكثر توفراً.
* المستثمرون دائماً يركزون على الجداول الأسبوعية واليومية لتحديد اتجاهات المدى الطويل والتنبؤ بحركات أسعار المدى الطويلة.
* الآخرون قد يستخدمون مجموعة مؤتلفة من جداول المدى الطويل والمدى القصير.
كيف يتم تكوين الجداول ؟ How are Charts Formed?
سنقوم بشرح تكوين Candlestick Chart & Bar Chart & Line Chart، وبالرغم من أن هناك طرق أخرى متاحة فإن هذه الثلاثة تعتبر من أكثر الطرق شعبية لعرض بيانات الأسعار.
جدول الخط:Line Chart
يعتبر جدول الخط من أبسط الجداول البيانية، حيث يتكون برسم نقطة سعر واحدة " عادة الإقفال" من السند المالي في فتره زمنيه.

بعض المستثمرون و المضاربين يعتبرون مستوى الإقفال أكثر أهمية من الافتتاح سوآ عاليا أو منخفضا، وبالانتباه إلى الإقفال فقط فإن التأرجحات يتم تجاهلها، وأيضاً تستخدم جداول الخط عند الافتتاح حيث لا تتوفر نقاط البيانات المرتفعة والمنخفضة.
جدول القضيب:Bar Chart
يكون جدول القضيب من أكثر الطرق رواجاً ويتطلب الارتفاع و الانخفاض والإغلاق لرسم السعر لكل فترة،
ويتم تمثيل الارتفاع و الانخفاض بأعلى وأسفل القضيب العمودي والإغلاق يمثله الخط الأفقي القصير الذي يقاطع القضيب الرأسي، في الجدول اليومي فأن كل قضيب يمثل الارتفاع و الانخفاض والإغلاق لنفس اليوم، وقد يكون للجداول ألأسبوعيه قضيب لكل أسبوع بناء علي إغلاق الخميس والارتفاع و الانخفاض لذلك الأسبوع.

ويمكن أيضاً أن يتم عرض الجداول القضيبية باستخدام الافتتاح والارتفاع والانخفاض والإغلاق، الفرق الوحيد هو إضافة سعر الافتتاح الذي تم عرضه كخط أفقي قصير يمتد إلى يسار القضيب. أما إذا ما كان جدول القضيب يشتمل أو لا يشتمل على الافتتاح فإن ذلك يعتمد على البيانات المتوفرة.

جدول عصى الشمعدان: Candlestick Chart
نشأت في اليابان منذ 300 عام مضت وقد أصبحت جداول عصى الشمعدان رائجة تماماً في السنوات الحالية، وبالنسبة لجدول عصى الشمعدان فإن الافتتاح والارتفاع والانخفاض والإغلاق تكون كلها مطلوبة. وتقوم عصى الشمعدان على أساس سعر الافتتاح والارتفاع والانخفاض والإغلاق في اليوم، أما عصى الشمعدان الأسبوعية فتقوم على أساس افتتاح يوم السبت ومدى الارتفاع والانخفاض الأسبوعي وإغلاق الخميس.
إن كثيراً من المضاربين والمستثمرين يعتقدون بأن جداول عصى الشمعدان تكون سهلة القراءة خاصة في العلاقة بين الافتتاح والإغلاق، وتتكون عصى الشمعدان البيضاء عندما يكون الإغلاق أعلى من الافتتاح بينما تتكون عصى الشمعدان السوداء عندما يكون الإغلاق أدنى من الافتتاح، القسم الأبيض والأسود المتكون من الفتح والغلق يطلق عليه لفظ الجسم " الجسم الأبيض أو الجسم الأسود " والخطوط الأعلى والأسفل يطلق عليها الظلال وتمثل الارتفاع والانخفاض.

قياس السعر
توجد هناك طريقتين لعرض مقياس السعر على المحور الصادي: حسابية ولوغاريثمية
المقياس الحسابي:
يعرض 10 نقاط "أو دولارات" كالبعد العمودي نفسه لا يهم مستوى السعر وكل وحدة قياس تكون هي نفسها في كل المقياس الكلي، فإذا تقدم السهم من 10 إلى 80 خلال فترة 6 أشهر فإن التحرك من 10 إلى 20 يبدو أنه يكون نفس المسافة كالتحرك من 70 إلى 80. حتى أن هذا التحرك يكون نفسه في الفترات المطلقة.
المقياس اللوغاريثمي:
يقيس تحركات السعر في فترات نسبة مئوية وقد يمثل التقدم من 10 إلى 20 زيادة 100%، والتقدم من 20 إلى 40 قد يكون أيضاً 100% كالتقدم من 40 إلى 80. وتبدو كل هذه الثلاثة كالبعد العمودي نفسه على المقياس اللوغاريثمي كما أن معظم برامج الجدولة ترجع إلى المقياس اللوغاريثمي كمقياس شبه لوغاريثمي لأن محور الزمن لا زال يتم عرضه حسابياً.

النقاط الأساسية لفوائد المقاييس الحسابية والشبه لوغاريثمية:
·المقاييس الحسـابية مفيدة عندما يكون مدى السعر مقتصراً على مدى ضيق نسبياً.
·يمكن أن تكون المقاييس الحسابية مفيدة لجداول الفترة القصيرة، ويتم توضيح تحركات الأسعار " خاصة للأسهم" بالدولار وتعكس تحركات دولار لدولار.
·تكون المقاييس شبه اللوغاريثمية مفيدة عندما يتحرك السعر بشكل بارز سواء في إطار زمني قصير أو ممتد.
·وتميل خطوط الاتجاه لتناسب الانخفاضات بشكل أفضل في المقاييس شبه اللوغاريثمية.
·يمكن أن تكون المقاييس شبه اللوغاريثمية مفيدة لجداول الفترة الطويلة لقياس تحركات النسبة المئوية خلال فترة طويلة من الزمن، وتوضع التحركات الواسعة في المنظور.
·ويتم الحكم على الأسهم وكثير من السندات المالية الأخرى بفترات نسبية خلال استخدام معدلات مثل PE والإيرادات / الأسعار ويوضع هذا في الاعتبار فإنه أيضاً يتم تحليل تحركات السعر في فترات نسبة مئوية.
مقدمه عن النماذج:Introduction to Chart Patterns
هناك مئات الألوف من المشاركين في السوق يشترون ويبيعون السندات المالية لمختلف الأسباب: مثل الأمل في الربح والخوف من الخسارة والضرائب والتغطية القصيرة والتغطية والتوقف من الخسارة واستهداف السعر والتحليل الأساسي والتحليل الفني وتوصيات السمسار وغيرها.
النماذج تضع الشراء والبيع في المنظور السليم بتوحيد قوى العرض والطلب في صورة موجزة كسجل صوري كامل لكل سهم فإن النماذج توفر إطار عمل لتحليل مدى المعركة بين الارتفاعات والانهيارات، والأكثر أهمية من ذلك فإن النماذج والتحليل الفني يمكن أن يساعدا في تحديد من يكسب المعركة مما يسمح للمضاربين والمستثمرين باتخاذ مواقعهم بناءً على ذلك.
ويمكن استخدام تحليل النموذج لعمل تنبؤات قصيرة المدى أو طويلة المدى، ويمكن أن تكون البيانات يومياً، أو أسبوعياً، أو شهرياً وقد تكون النماذج قصيرة كيوم واحد أو طويلة كسنوات والفجوات والانعكاسات الخارجية قد تتشكل في موسم تجاري واحد.

مجموعتين سائدتين:Tow Dominant Groups
المعتقدان الأساسيان في التحليل الفني هما: اتجاه الأسعار وأن التاريخ يعيد نفسه، الاتجاه الصاعد يشير إلى أن قوى الطلب " bulls " تحت السيطرة ويشير الاتجاه النازل على أن قوى العرض "bears" تحت السيطرةوبناءً على ذلك فإن الأسعار لا تتجه إلى الأبد وكلما ينتقل ميزان القوة يبدأ النموذج في البروز والانبثاق ولذلك فإن الغالبية العظمى من النماذج تقع في مجموعتين رئيسية: الانعكاسية والمستمرة
النماذج الأنعكاسيه: Reversal Patterns
تغير الاتجاه وأنه يمكن أن تنقسم على أشكال أعلى وأدنى.
النماذج المستمر ه:Continuation Patterns
فإنها تشير إلى التوقف في الاتجاه كما تشير إلى أن الاتجاه السابق سيبدأ بعد فترة زمنية.
أنواع النماذج الأنعكاسيه:Type Of Reversal Patterns
1- الوتد الصاعد ( نموذج انعكاسي )
Rising Wedge
الوتد الصاعد يمثل نموذج (هبوط) يبدأ واسع في الأسفل ويتقلص كلما تتحرك الأسعار إلى أعلى
يمكن أن يكون الوتد الصاعد واحد من أكثر النماذج صعوبة في التعرف عليه بدقة ومهارة، وبما أنه شكل متماسك إلا أن خسارة كمية التحرك إلى الجانب الأعلى في كل ارتفاع متتالي تعطي النموذج تحيزية الفظ، لذلك فإن سلاسل الارتفاعات الأعلى والانخفاضات الأعلى تحافظ على الاتجاه المتفائل، ويدل الارتفاع النهائي على أن قوى الطلب قد فازت أخيراً وبالمثل الأسعار الأقل، ولا توجد هناك تقنيات قياس لتقدير الانحدار ولذا فإنه يجب استخدام جوانب أخرى من التحليل الفني للتنبؤ بالأسعار المستهدفة.

2- الوتد الهابط ( انعكاسي )
Falling Wedge
الوتد الهابط يمثل نموذج bullish يبدأ عريض في القمة ويتقلص كلما تتحرك الأسعار إلى أدنى، وتشكل حركة السعر مخروطاً ينحدر إلى أسفل كلما تتقارب ارتفاعات وانخفاضات ردة الفعل كما أن الوتد الهابط يمكن أيضاً أن يلائم الفئة المستمرة، وكنموذج مستمر فإن الوتد الهابط لا يزال ينحدر إلى أسفل إلا أن الانحدار يكون عكس الاتجاه إلى أعلى السائد، وكنموذج انعكاسي فإن الوتد الهابط ينحدر إلى أسفل ومع الاتجاه السائد، وبدون اعتبار للنوع " انعكاسي أو مستمر " فإن الأوتاد الهابطة تعتبر كنماذج bullish.

وكما هو الحال مع الأوتاد الصاعدة فإن الوتد الهابط قد يكون واحد من أكثر النماذج صعوبة في معرفته بدقة، وعندما تتكون الارتفاعات الأدنى والانخفاضات الأدنى كما في حالة الوتد الهابط فإن السند المالي يبقى في اتجاه أسفل، ويصمم الوتد الهابط لتحديد الانخفاض في كمية التحرك إلى الجانب الأسفل وينبه الفنيين إلى الاتجاه المحتمل للانعكاس، وبالرغم من أن ضغط البيع قد يكون متلاشياً فإن الطلب لا يفوز حتى تنقطع المقاومة، كما هو الحال مع معظم النماذج فإنه يكون من المهم أن تنتظر الارتفاع وتجمع الجوانب الأخرى للتحليل الفني لكي تثبت الإشارات.
أيهما نصدق ...
1 أنه هو نموذج انعكاسي (عاكس للاتجاه)
https://arincen.com/forex-text-academy/15/60
2 أحد النماذج الاستمرارية التصحيحية الإيجابية
https://my.mec.biz/t47232.html
============
شكل نموذج الكوب والعروة وخصائصة

إذا كنت من متابعي أسواق الفوركس بشكل جيد فمن المؤكد أنك سمعت بما يسمى بنموذج الكوب والعروة cup with handle، وبسبب خبرتك المتواضعة في مصطلحات ومفاهيم أسواق الفوركس فإنك تجهل ما المقصود بهذا المصطلح، ولذلك في درس اليوم سوف نعلمك ما المقصود بنموذج الكوب والعروة cup with handle.
نموذج الكوب والعروة cup with handle هو أحد أهم النماذج الفنية patterns الغير متعارف عليها من قبل الكثيرين من المتداولين، وتعد والنماذج الفنية هي واحدة من أهم أدوات التحليل الفني التي يجب عليك أن تتعلمها في سوق الفوركس لتكون متداول جيد، وذلك نظراً لأنها تكون أشكال أو نماذج ثابتة وتتكرر كثيراً، كما أنها تمتاز بنسبة النجاح العالية.
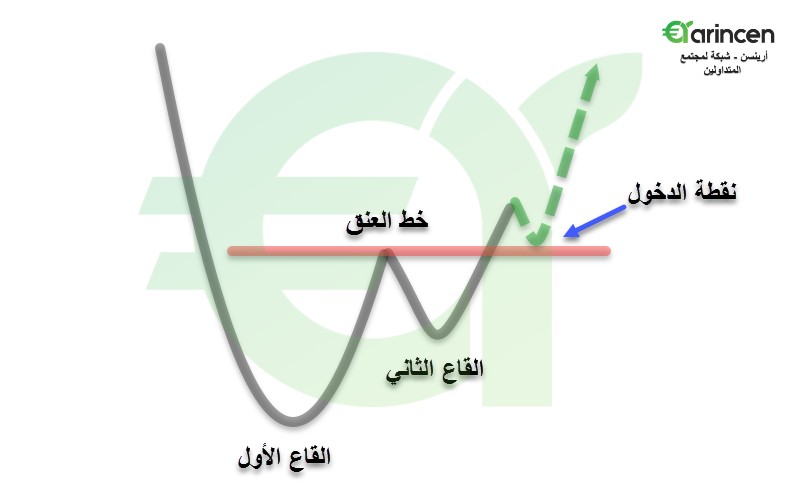
شكل نموذج الكوب والعروة cup with handle:
خصائص نموذج الكوب والعروة cup with handle:
* يسمى بهذا الاسم لأنه يشبه الكوب والعروة فعلاً ومن خصائصه:
1- أنه هو نموذج انعكاسي (عاكس للاتجاه) يأتي بعد الاتجاه الهابط ليحوله إلى صاعد.
2- ويكون السوق في البداية في اتجاه هابط.
3- يأتي النموذج وهو يشكل القاع الأول ويكون قاع كبير، ثم القاع الثاني ويكون قاع صغير أو العكس أي يكون الأول صغير والثاني كبير.
4- وعند كسر خط العنق لأعلى وهو القمة بين القاعين يبدأ السوق في الصعود.
5- ويمكن الاستفادة بعد كسر خط العنق لأعلى والدخول في صفقات شرائية.
6- أما بالنسبة للهدف يكون بقياس المسافة بين القيعان المتكونة وخط العنق وإسقاطها من نقطة الكسر.
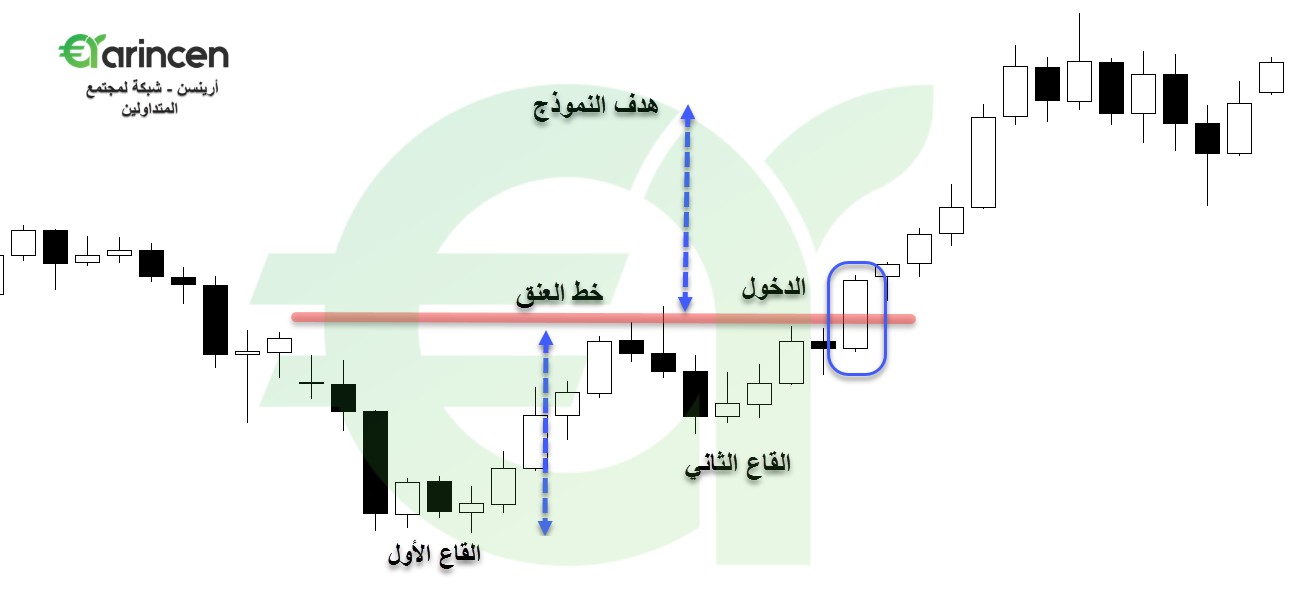
من الصورة السابقة نستطيع أن نشرح الكوب والعروة كالآتي:
1- كان السوق في اتجاه هابط في البداية.
2- ثم تكون كلاً من القاع الأول (القاع الكبير) والثاني (القاع الصغير).
3- وتم كسر خد العنق (القمة بين القاعين) لأعلى.
4- يمكن التنبؤ عند كسر خط العنق لأعلى بالصعود وتكون نقطة الدخول بعد كسر خط العنق.
5- وبعد كسر خط العنق يتحول الاتجاه من الهبوط إلى الصعود.
6- ويتمثل هدف النموذج في قياس المسافة من القاع الأكبر إلى خط العنق وإسقاطها من نقطة الكسر.
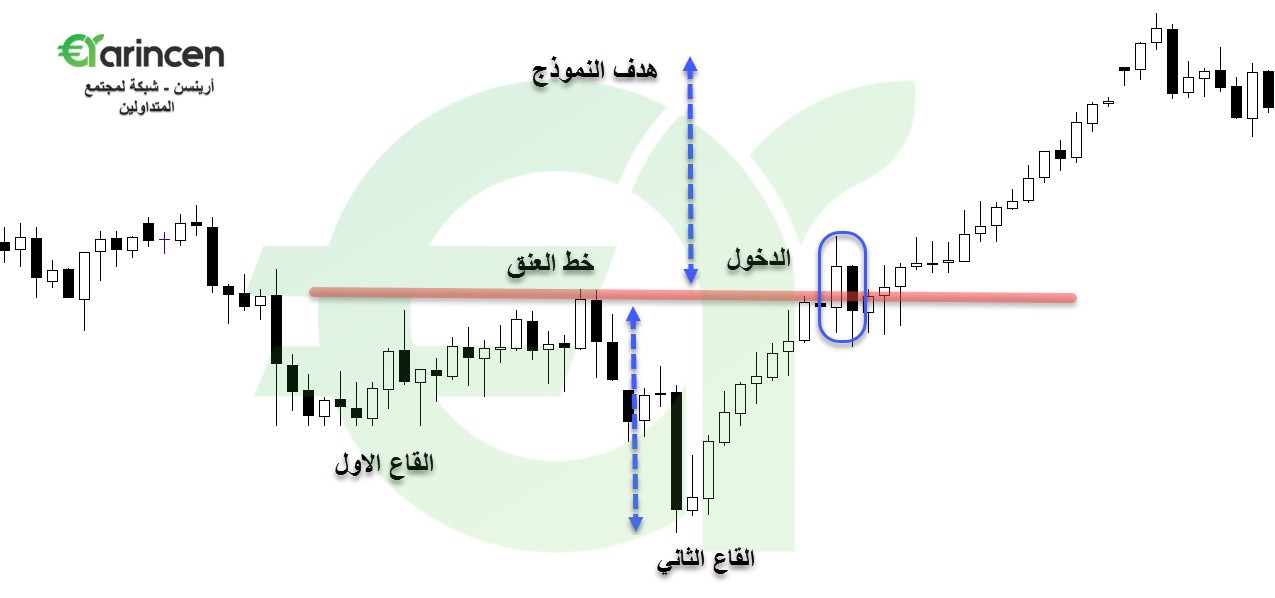
من الصورة السابقة نستطيع أن نشرح الكوب والعروة كالآتي:
1- كان السوق في اتجاه هابط في البداية.
2- يتكون القاع الأول (القاع الصغير) ثم الثاني (القاع الكبير)، ويجب أن تلاحظ هنا أنه من المكن أن يأتي القاع الكبير هو القاع الأول أو لا ويكون النموذج صحيح في كلتا الحالتين.
3- تم كسر خط العنق (القمة بين القاعين) لأعلى.
4- ويمكن التنبؤ عند كسر خط العنق لأعلى بالصعود وتكون نقطة الدخول بعد كسر خط العنق.
5- أما بعد كسر خط العنق يتحول الاتجاه من الهبوط إلى الصعود.
6- ومن الجدير بالذكر أن هدف النموذج هو قياس المسافة من القاع الأكبر إلى خط العنق وإسقاطها من نقطة الكسر.
تذكر أن:
* نموذج الكوب والعروة هو نموذج عاكس للاتجاه يأتي بعد الاتجاه الهابط ويحوله إلى صاعد.
* يكون هناك قاع أكبر من قاع بشكل ملحوظ، ولا بأس إن أتى القاع الأول هو القاع الصغير أو العكس، فكلاهما يكون النموذج صحيح.
* خط العنق هو خط يرسم على القمة المتكونة بين القاعين.
* يجب كسر خط العنق للدخول في مراكز شرائية.
* ويتمثل هدف النموذج في قياس المسافة من القاع الأكبر إلى خط العنق وإسقاطها عند نقطة الكسر.
===================================
شرح نموذج الكوب والعروة cup with a handle + ورشة عمل
هو أحد النماذج الاستمرارية التصحيحية الإيجابية والتي تتكون بعد ارتفاع السعر أي أنها تتكون خلال ترند صاعديحدث بعدها اختراق للأعلى .
وقد اكتشف هذا النموذج ويليام أونيل وقد قدم في كتابه How To Make Money .عام 1989
وصف النموذجفي هذا النموذج يكون هناك جزءان:
أولا - الكوب
ويأتي بعد ارتفاع السعر ويظهر على شكل قاع دائري .ويتكون من طرفين أو قمتين-1الطرف الأيسريمثل بداية النموذج - 2القاعيستقر السعرعند القاع لفترة - 3الطرف الأيمنيرتفع السعر مره اخرى مكونا الطرف الأيمن للكوب ويكون مساوياً للطرف الأيسر أو أعلى منه قليلا وبعد تكون الطرف الأيمن يكون الكوب قد اكتمل .ثانيامرحلة تكوين العروةوتتكون بعد اكتمال تكون الكوب وتكون في الجهة اليمنى للكوب و تكون تصحيحاً للارتفاع الذي حصل لتكوين الطرف الأيمن من الكوب .و العروة،يمكن أن تتخذ عدة أشكال مختلفة أو على شكل عروة عادية
مثال
هدف النموذج
يتم حساب السعر المستهدف بطريقتين
الأولى
قياس المسافة بين خط الرقبة وقاع الكوب ثم إضافة نفس المسافة إلى نقطة اختراق النموذج
الثانيةقياس المسافة بين قمة الطرف الأيمن وقاع الكوب ثم إضافة الناتج إلى نقطة اختراق العروة
السعر المستهدف = قمة الطرف الأيمن – قاع الكوب = ( الناتج )
( الناتج ) + نقطة اختراق العروة = الهدف
 الصور المرفقة

1 أنه هو نموذج انعكاسي (عاكس للاتجاه)
https://arincen.com/forex-text-academy/15/60
2 أحد النماذج الاستمرارية التصحيحية الإيجابية
https://my.mec.biz/t47232.html
============
شكل نموذج الكوب والعروة وخصائصة

إذا كنت من متابعي أسواق الفوركس بشكل جيد فمن المؤكد أنك سمعت بما يسمى بنموذج الكوب والعروة cup with handle، وبسبب خبرتك المتواضعة في مصطلحات ومفاهيم أسواق الفوركس فإنك تجهل ما المقصود بهذا المصطلح، ولذلك في درس اليوم سوف نعلمك ما المقصود بنموذج الكوب والعروة cup with handle.
نموذج الكوب والعروة cup with handle هو أحد أهم النماذج الفنية patterns الغير متعارف عليها من قبل الكثيرين من المتداولين، وتعد والنماذج الفنية هي واحدة من أهم أدوات التحليل الفني التي يجب عليك أن تتعلمها في سوق الفوركس لتكون متداول جيد، وذلك نظراً لأنها تكون أشكال أو نماذج ثابتة وتتكرر كثيراً، كما أنها تمتاز بنسبة النجاح العالية.
شكل نموذج الكوب والعروة cup with handle:

خصائص نموذج الكوب والعروة cup with handle:
* يسمى بهذا الاسم لأنه يشبه الكوب والعروة فعلاً ومن خصائصه:
1- أنه هو نموذج انعكاسي (عاكس للاتجاه) يأتي بعد الاتجاه الهابط ليحوله إلى صاعد.
2- ويكون السوق في البداية في اتجاه هابط.
3- يأتي النموذج وهو يشكل القاع الأول ويكون قاع كبير، ثم القاع الثاني ويكون قاع صغير أو العكس أي يكون الأول صغير والثاني كبير.
4- وعند كسر خط العنق لأعلى وهو القمة بين القاعين يبدأ السوق في الصعود.
5- ويمكن الاستفادة بعد كسر خط العنق لأعلى والدخول في صفقات شرائية.
6- أما بالنسبة للهدف يكون بقياس المسافة بين القيعان المتكونة وخط العنق وإسقاطها من نقطة الكسر.

من الصورة السابقة نستطيع أن نشرح الكوب والعروة كالآتي:
1- كان السوق في اتجاه هابط في البداية.
2- ثم تكون كلاً من القاع الأول (القاع الكبير) والثاني (القاع الصغير).
3- وتم كسر خد العنق (القمة بين القاعين) لأعلى.
4- يمكن التنبؤ عند كسر خط العنق لأعلى بالصعود وتكون نقطة الدخول بعد كسر خط العنق.
5- وبعد كسر خط العنق يتحول الاتجاه من الهبوط إلى الصعود.
6- ويتمثل هدف النموذج في قياس المسافة من القاع الأكبر إلى خط العنق وإسقاطها من نقطة الكسر.

من الصورة السابقة نستطيع أن نشرح الكوب والعروة كالآتي:
1- كان السوق في اتجاه هابط في البداية.
2- يتكون القاع الأول (القاع الصغير) ثم الثاني (القاع الكبير)، ويجب أن تلاحظ هنا أنه من المكن أن يأتي القاع الكبير هو القاع الأول أو لا ويكون النموذج صحيح في كلتا الحالتين.
3- تم كسر خط العنق (القمة بين القاعين) لأعلى.
4- ويمكن التنبؤ عند كسر خط العنق لأعلى بالصعود وتكون نقطة الدخول بعد كسر خط العنق.
5- أما بعد كسر خط العنق يتحول الاتجاه من الهبوط إلى الصعود.
6- ومن الجدير بالذكر أن هدف النموذج هو قياس المسافة من القاع الأكبر إلى خط العنق وإسقاطها من نقطة الكسر.
تذكر أن:
* نموذج الكوب والعروة هو نموذج عاكس للاتجاه يأتي بعد الاتجاه الهابط ويحوله إلى صاعد.
* يكون هناك قاع أكبر من قاع بشكل ملحوظ، ولا بأس إن أتى القاع الأول هو القاع الصغير أو العكس، فكلاهما يكون النموذج صحيح.
* خط العنق هو خط يرسم على القمة المتكونة بين القاعين.
* يجب كسر خط العنق للدخول في مراكز شرائية.
* ويتمثل هدف النموذج في قياس المسافة من القاع الأكبر إلى خط العنق وإسقاطها عند نقطة الكسر.
===================================
شرح نموذج الكوب والعروة cup with a handle + ورشة عمل
هو أحد النماذج الاستمرارية التصحيحية الإيجابية والتي تتكون بعد ارتفاع السعر أي أنها تتكون خلال ترند صاعديحدث بعدها اختراق للأعلى .
وقد اكتشف هذا النموذج ويليام أونيل وقد قدم في كتابه How To Make Money .عام 1989
وصف النموذجفي هذا النموذج يكون هناك جزءان:
أولا - الكوب
ويأتي بعد ارتفاع السعر ويظهر على شكل قاع دائري .ويتكون من طرفين أو قمتين-1الطرف الأيسريمثل بداية النموذج - 2القاعيستقر السعرعند القاع لفترة - 3الطرف الأيمنيرتفع السعر مره اخرى مكونا الطرف الأيمن للكوب ويكون مساوياً للطرف الأيسر أو أعلى منه قليلا وبعد تكون الطرف الأيمن يكون الكوب قد اكتمل .ثانيامرحلة تكوين العروةوتتكون بعد اكتمال تكون الكوب وتكون في الجهة اليمنى للكوب و تكون تصحيحاً للارتفاع الذي حصل لتكوين الطرف الأيمن من الكوب .و العروة،يمكن أن تتخذ عدة أشكال مختلفة أو على شكل عروة عادية
مثال
هدف النموذج
يتم حساب السعر المستهدف بطريقتين
الأولى
قياس المسافة بين خط الرقبة وقاع الكوب ثم إضافة نفس المسافة إلى نقطة اختراق النموذج
الثانيةقياس المسافة بين قمة الطرف الأيمن وقاع الكوب ثم إضافة الناتج إلى نقطة اختراق العروة
السعر المستهدف = قمة الطرف الأيمن – قاع الكوب = ( الناتج )
( الناتج ) + نقطة اختراق العروة = الهدف

التعديل الأخير:
صباحكم خير
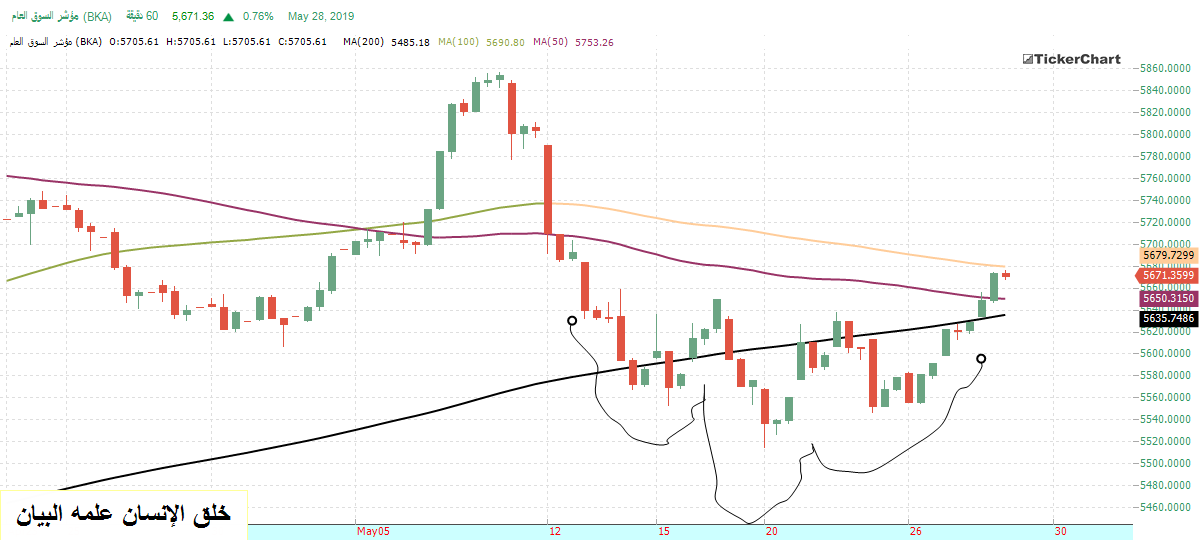
متابعة للمشاركة اعلاه
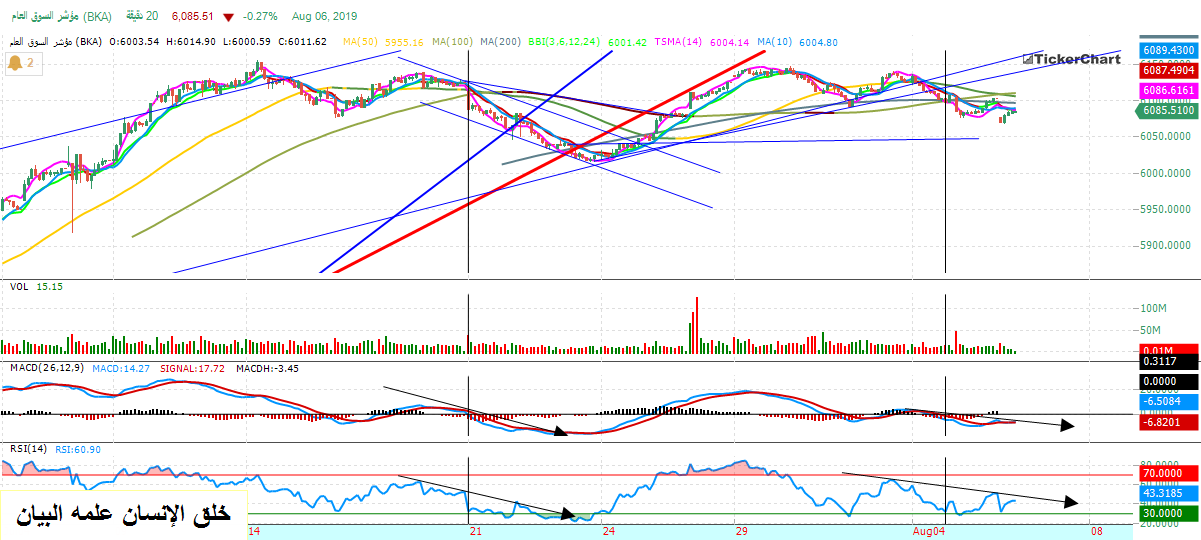
مسار السوق الكويتي
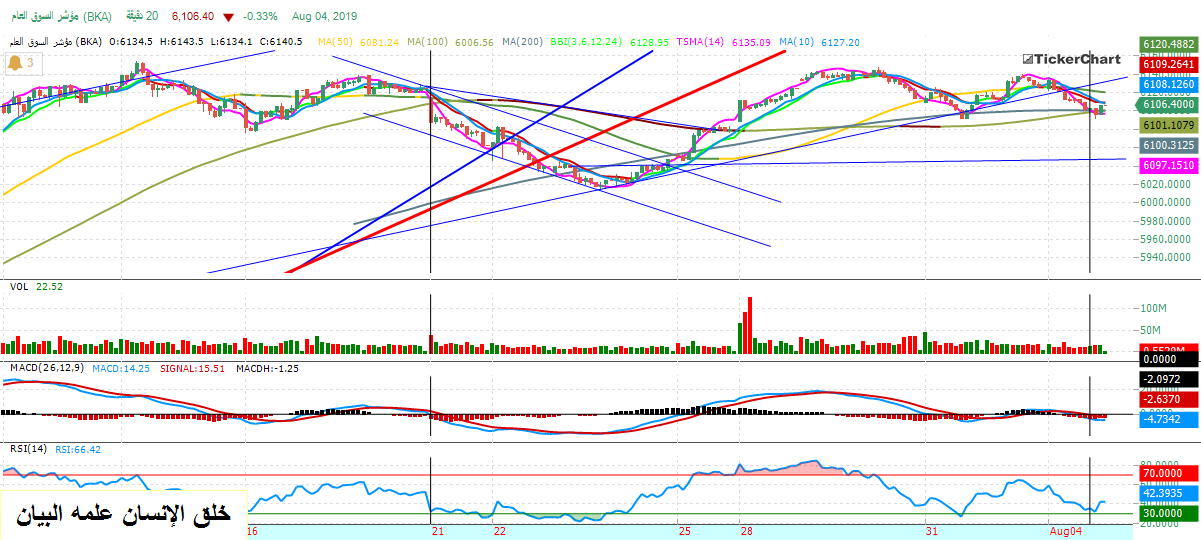
كنت قد قلت حين تشكل نموذج كوب و عروة الثاني .. الحاكم في الامر المؤشرات
... و المؤشرات اسفله تبدو ايجابية .. و صعد السعر قليلا
:::::::::::::::::::
و من المتابعة يلاحظ ان المؤشرات اصلا كانت سلبية .. و لايمكن الحكم عليها من تداول يوم او يومين و انما من اتجاه المؤشر من آخر قمة او قاع .. طالع الاسهم في اسفل الشارت كلها سلبية
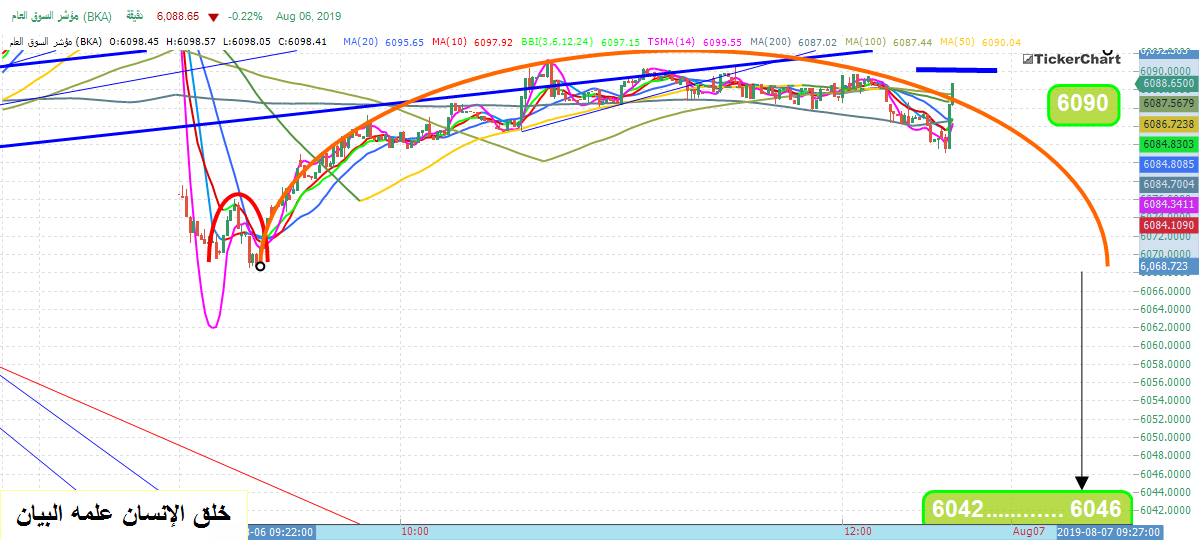
و فعلا كان المؤشر حينها 6102 و نزل الى 6068
شلي خلاني اقول ان المؤشرات اسفله تبدو ايجابية .. و صعد السعر قليلا ..
الاجابة : العاطفة ... نعم العاطفة تخليك تقرأ المؤشرات بما يلبي رغبتك .. ودك ان المؤشر يطلع ادور اي شيء لتدعم رغبتك
و هذه مشكلة كبيرة
يجب ان تكون متجردا من العواطف ..حازم .. حاد في حكمك .. محايد طول الوقت
اصطحاب التعاطف و مشاعر الرغبة و التطلع و الامل و غيرها في سوق المال يعني الخسارة المؤكدة و الفشل في العمل بالبورصة
ملاحظة أخرى
كلامي حول ان المؤشرات هي الحاكم في نجاح النماذج غير صحيح ... و ايضا العاطفة كان لها دور هنا
فالنموذج تحكمه معطياته الخاصة .. و تأتي المؤشرات كمكمل للنموذج .. و ليس حاكمه لها
الآن الوضع الفني الصحيح ان هدف النموذج هو 6042 ... و لا يلغى الهدف الا اذا ارتفع المؤشر فوق 6114
قول فصل و انتهى ...
--------------------
لا عواطف في التداول و انما ارقام تتحرك في كل اتجاه و في اي وقت
التعديل الأخير:
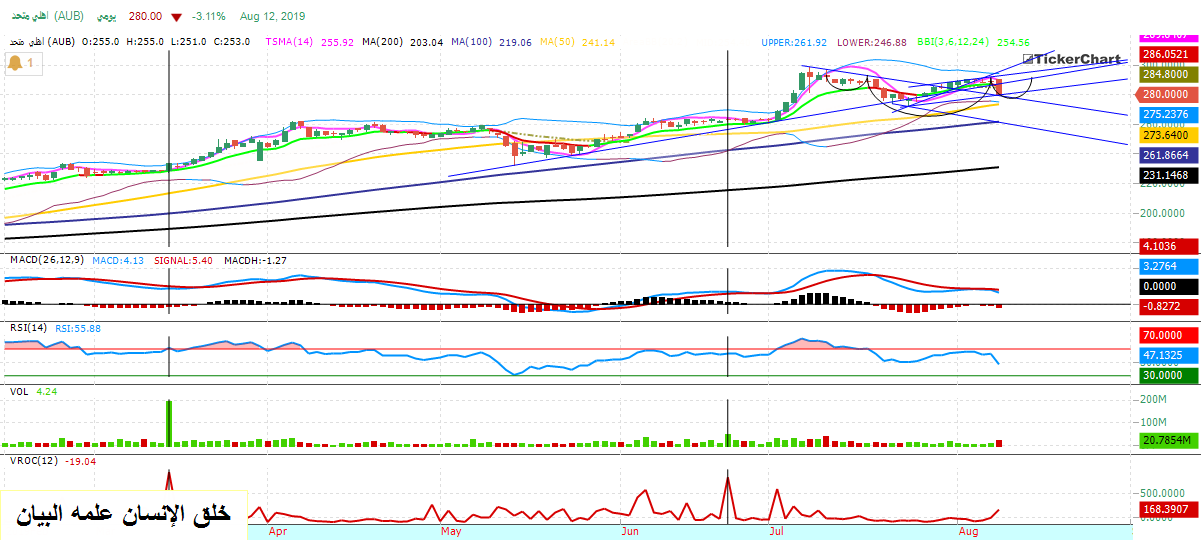
Using Volume Rate Of Change To Confirm Trends
BY INVESTOPEDIA STAFF
Updated Jun 25, 2019
In Volume Oscillator Confirms Price Movement we looked at the measurement of volume by way of an oscillator using two moving averages. In this article we look at the volume rate of change (V-ROC), and we'll focus on the importance of price movements and volume in the study of market trends.
In the last decade, we've seen triple-digit swings on the Dow Jones Industrial Index to both the upside and the downside. A newcomer to the science of technical analysis may not have realized that some of these moves lacked conviction, as volume didn't always support the price movement. Chartists are not the least bit interested in a 5 to 10% move in a stock price if the volume moving the price is a fraction of the normal daily volume for that particular issue. On the other hand, since the Nasdaq market volume reaches or surpasses two billion shares per day, significant price action will trigger the interest of analysts. If price movements are significantly less than 5 to 10%, you might as well go golfing.
Volume Trend Indicator
The volume rate of change is the indicator that shows whether or not a volume trend is developing in either an up or down direction. You may be familiar with price rate of change (discussed here), which shows an investor the rate of change measured by the issue's closing price. To calculate this, you need to divide the volume change over the last n-periods (days, weeks or months) by the volume n-periods ago. The answer is a percentage change of the volume over the last n-periods. Now, what does this mean? If the volume today is higher than n-days (or weeks or months) ago, the rate of change will be a plus number. If volume is lower, the ROC will be minus number. This allows us to look at the speed at which the volume is changing. (For more on trend strength, check out ADX: The Trend Strength Indicator.)
One of the problems that analysts have with the V-ROC is determining the period of time to measure the rate of change. A shorter period of 10 to 15 days, for example, would show us the peaks created by a sudden change, and, for the most part, trendlines could be drawn. For a more realistic look, I would suggest using a 25- to 30-day period; this length of time makes the chart look more rounded and smooth. Shorter periods tend to produce a chart that is more jagged and difficult to analyze.
:max_bytes(150000):strip_icc():format(webp)/091002_chart2small-5c0584afc9e77c0001d3f0e3)
Figure 1: Volume Rate of Change - 14-Day Period
استخدام حجم معدل التغيير لتأكيد الاتجاهات
فيس بوك
تغريد
ينكدين
من قبل فريق الاستثمار
تم التحديث في 25 يونيو 2019
في مذبذب الحجم يؤكد حركة السعر نظرنا في قياس الحجم عن طريق مذبذب باستخدام اثنين من المتوسطات المتحركة. في هذه المقالة ، نلقي نظرة على معدل حجم التغيير (V-ROC) ، وسنركز على أهمية تحركات الأسعار وحجمها في دراسة اتجاهات السوق.
في العقد الماضي ، شهدنا تقلبات ثلاثية الأرقام على مؤشر داو جونز الصناعي في الاتجاه الصعودي والجانب السلبي على حد سواء. ربما لم يدرك الوافد الجديد إلى علم التحليل الفني أن بعض هذه التحركات كانت تفتقر إلى الاقتناع ، لأن الحجم لم يكن دائمًا يدعم حركة السعر. لا يهتم اختصاصيو الخرائط على الأقل بحركة من 5 إلى 10٪ في سعر السهم إذا كان الحجم الذي يحرك السعر جزءًا صغيرًا من الحجم اليومي المعتاد لهذه المشكلة بعينها. من ناحية أخرى ، نظرًا لأن حجم سوق ناسداك يصل أو يتجاوز ملياري سهم يوميًا ، فإن تحركات الأسعار المهمة ستثير اهتمام المحللين. إذا كانت حركات الأسعار أقل بكثير من 5 إلى 10٪ ، فقد تذهب أيضًا إلى لعب الجولف.
حجم مؤشر الاتجاه
معدل حجم التغيير هو المؤشر الذي يوضح ما إذا كان اتجاه الحجم يتطور في اتجاه صعودي أو هبوطي. قد تكون على دراية بمعدل سعر التغيير (تمت مناقشته هنا) ، والذي يوضح للمستثمر معدل التغيير الذي تم قياسه بسعر إغلاق الإصدار. لحساب ذلك ، تحتاج إلى تقسيم تغيير حجم الصوت على فترات n الأخيرة (أيام أو أسابيع أو أشهر) على وحدة التخزين منذ فترات. الجواب هو تغيير النسبة المئوية للحجم على فترات n الأخيرة. الآن ماذا يعني هذا؟ إذا كان حجم التداول اليوم أعلى من n-day (أو أسابيع أو أشهر) قبل ذلك ، فسيكون معدل التغيير هو رقم زائد. إذا كان حجم الصوت أقل ، فسيكون رقم ROC ناقصًا. يسمح لنا ذلك بالنظر إلى السرعة التي يتغير بها مستوى الصوت. (لمعرفة المزيد حول قوة الاتجاه ، راجع ADX: مؤشر قوة الاتجاه.)
إحدى المشكلات التي يواجهها المحللون في V-ROC هي تحديد الفترة الزمنية لقياس معدل التغيير. على سبيل المثال ، ستظهر لنا فترة أقصر من 10 إلى 15 يومًا القمم التي أحدثها التغيير المفاجئ ، ويمكن رسم خطوط الاتجاه في معظم الأحيان. لإلقاء نظرة أكثر واقعية ، أود أن أقترح استخدام فترة 25 إلى 30 يوما ؛ هذا طول الوقت يجعل الرسم البياني يبدو أكثر تقريبًا وسلسًا. تميل الفترات الأقصر إلى إنتاج مخطط أكثر خشنة ويصعب تحليله.
aistikhdam h
Chart Created with Tradestation
In the chart of the Nasdaq Composite Index, you can see a classic sell-off with the V-ROC reaching a high of 249.00 on December 13, 2001 (based on a 14-day period). In fact, if you study the chart closely, you can see that the ROC becomes positive for the first time on Dec 12, 2001, with a measurement of 19.61. On the next day the measurement jumps to 249.00 on the closing. The Nasdaq, however, had a high of 2065.69 on December 6 (ROC, +8.52) and then fell to negative numbers until December 12. By using a 14-day period, we cannot recognize this slide until the Index loses 119.18 points (approx. 6.5%) to the level of 1946.51. This would confuse most, were it not for the ability to change our period of time, in this case, to a 30-day period, shown in Figure 2.
:max_bytes(150000):strip_icc():format(webp)/091002_chart1small-5c0584b146e0fb000164ddcb)
Figure 2: Volume Rate of Change - 30-Day Period
Chart Created with Tradestation
In the second chart of the Nasdaq Composite Index, which uses a 30-day period, you can clearly see that in and around December 12 and 13, 2001, the ROC barely shows a positive number, and it is not until January 3, 2002 that a positive number appears, as the price action rises substantially from 1987.06 to 2098.88. On the ninth of the month, there is a move to the upside of 111.82 points. This positive value means there is enough market support to continue to drive price activity in the direction of the current trend. A negative value suggests there is a lack of support, and prices may begin to become stagnant or reverse.
We can see that even with a 14-day period, the V-ROC over the year shown on this chart, for the most part, moves quietly above and below the zero line. This indicates that there is no real conviction for there to be a trending market. The only real jump in price action that most investors missed is the move in late July, occurring over a period of five trading days, which, as you can see in the chart, has given almost everything back. Another interesting point is the lack of volume behind the price action as it moves upward. This is evident in the period from August 5, 2002, when the Nasdaq closed at 1206.01, to Aug 22, 2002, when the index closed at 1422.95. During this time, the V-ROC remained negative, indicating to all technical analysts that the increasing price in the index would not hold.
The Bottom Line
Using the previous volume indicators, you can confirm price movements that have conviction and avoid buying or selling based on blips in the market that will soon be corrected. Watch the volume, and the trends will follow. Remember it's your money - invest it wisely.
Compete Risk Free with $100,000 in Virtual Cash
Put your trading skills to the test with our FREE Stock Simulator. Compete with thousands of Investopedia traders and trade your way to the top! Submit trades in a virtual environment before you start risking your own money. Practice trading strategies so that when you're ready to enter the real market, you've had the practice you need. Try our Stock Simulator today >>
aistikhdam ح
تم إنشاء الرسم البياني باستخدام Tradestation
في الرسم البياني لمؤشر Nasdaq Composite Index ، يمكنك أن ترى عمليات بيع كلاسيكية مع وصول V-ROC إلى 249.00 في 13 ديسمبر 2001 (على أساس فترة 14 يومًا). في الواقع ، إذا كنت تدرس الرسم البياني عن كثب ، يمكنك أن ترى أن ROC تصبح إيجابية لأول مرة في 12 ديسمبر 2001 ، بقياس 19.61. في اليوم التالي ، يقفز القياس إلى 249.00 عند الإغلاق. ومع ذلك ، كان مؤشر ناسداك مرتفعًا عند 2065.69 في 6 ديسمبر (ROC ، +8.52) ثم انخفض إلى أرقام سالبة حتى 12 ديسمبر. باستخدام فترة 14 يومًا ، لا يمكننا التعرف على هذه الشريحة حتى يخسر المؤشر 119.18 نقطة (تقريبًا 6.5 ٪) إلى مستوى 1946.51. هذا من شأنه أن يربك أكثر ، لولا القدرة على تغيير الفترة الزمنية لدينا ، في هذه الحالة ، إلى فترة 30 يومًا ، كما هو موضح في الشكل 2.
الشكل 2: معدل حجم التغيير - فترة 30 يوما
تم إنشاء الرسم البياني باستخدام Tradestation
في الرسم البياني الثاني لمؤشر Nasdaq Composite Index ، والذي يستخدم فترة 30 يومًا ، يمكنك أن ترى بوضوح أنه في وحول 12 و 13 ديسمبر 2001 ، بالكاد يظهر ROC رقمًا إيجابيًا ، ولم يستمر حتى 3 يناير 2002 يظهر هذا الرقم الإيجابي ، حيث ارتفعت حركة السعر بشكل كبير من 1987.06 إلى 2098.88. في التاسع من الشهر ، هناك تقدم نحو 111.82 نقطة. تعني هذه القيمة الإيجابية وجود دعم كافٍ للسوق لمواصلة دفع نشاط السعر في اتجاه الاتجاه الحالي. تشير القيمة السلبية إلى عدم وجود دعم ، وقد تبدأ الأسعار في الركود أو الانعكاس.
يمكننا أن نرى أنه حتى خلال فترة 14 يومًا ، يتحرك مؤشر V-ROC على مدار العام المبين على هذا الرسم البياني ، في معظمه ، بهدوء فوق وتحت خط الصفر. يشير هذا إلى عدم وجود قناعة حقيقية بوجود سوق متجه نحو الارتفاع. القفزة الحقيقية الوحيدة في حركة الأسعار التي فاتها معظم المستثمرين هي الحركة في أواخر يوليو ، والتي تحدث على مدى خمسة أيام تداول ، والتي ، كما ترون في الرسم البياني ، أعادت كل شيء تقريبًا. النقطة المهمة الأخرى هي قلة الحجم وراء حركة السعر حيث يتحرك صعودًا. هذا واضح في الفترة من 5 أغسطس 2002 ، عندما أغلق مؤشر ناسداك في 1206.01 ، إلى 22 أغسطس 2002 ، عندما أغلق المؤشر في 1422.95. خلال هذا الوقت ، بقيت V-ROC سلبية ، مما يشير إلى جميع المحللين الفنيين أن السعر المتزايد في المؤشر لن يصمد.
الخط السفلي
باستخدام مؤشرات الحجم السابقة ، يمكنك تأكيد تحركات الأسعار التي لديها قناعة وتجنب الشراء أو البيع على أساس التذبذب في السوق الذي سيتم تصحيحه قريبًا. مشاهدة حجم ، وسوف تتبع الاتجاهات. تذكر أنها أموالك - استثمرها بحكمة.
منافسة خالية من المخاطر مع 100،000 دولار في النقدية الافتراضية
ضع مهاراتك في التداول من خلال محاكي الأسهم المجاني. تنافس مع الآلاف من متداولي Investopedia واستبدل طريقك إلى القمة! يمكنك تقديم صفقات في بيئة افتراضية قبل أن تبدأ في المخاطرة بأموالك الخاصة. مارس استراتيجيات التداول بحيث تكون مستعدًا للدخول إلى السوق الحقيقية ، حيث تكون لديك الممارسة التي تحتاجها. جرب سهم Simulator اليوم >>
BY INVESTOPEDIA STAFF
Updated Jun 25, 2019
In Volume Oscillator Confirms Price Movement we looked at the measurement of volume by way of an oscillator using two moving averages. In this article we look at the volume rate of change (V-ROC), and we'll focus on the importance of price movements and volume in the study of market trends.
In the last decade, we've seen triple-digit swings on the Dow Jones Industrial Index to both the upside and the downside. A newcomer to the science of technical analysis may not have realized that some of these moves lacked conviction, as volume didn't always support the price movement. Chartists are not the least bit interested in a 5 to 10% move in a stock price if the volume moving the price is a fraction of the normal daily volume for that particular issue. On the other hand, since the Nasdaq market volume reaches or surpasses two billion shares per day, significant price action will trigger the interest of analysts. If price movements are significantly less than 5 to 10%, you might as well go golfing.
Volume Trend Indicator
The volume rate of change is the indicator that shows whether or not a volume trend is developing in either an up or down direction. You may be familiar with price rate of change (discussed here), which shows an investor the rate of change measured by the issue's closing price. To calculate this, you need to divide the volume change over the last n-periods (days, weeks or months) by the volume n-periods ago. The answer is a percentage change of the volume over the last n-periods. Now, what does this mean? If the volume today is higher than n-days (or weeks or months) ago, the rate of change will be a plus number. If volume is lower, the ROC will be minus number. This allows us to look at the speed at which the volume is changing. (For more on trend strength, check out ADX: The Trend Strength Indicator.)
One of the problems that analysts have with the V-ROC is determining the period of time to measure the rate of change. A shorter period of 10 to 15 days, for example, would show us the peaks created by a sudden change, and, for the most part, trendlines could be drawn. For a more realistic look, I would suggest using a 25- to 30-day period; this length of time makes the chart look more rounded and smooth. Shorter periods tend to produce a chart that is more jagged and difficult to analyze.
Figure 1: Volume Rate of Change - 14-Day Period
استخدام حجم معدل التغيير لتأكيد الاتجاهات
فيس بوك
تغريد
ينكدين
من قبل فريق الاستثمار
تم التحديث في 25 يونيو 2019
في مذبذب الحجم يؤكد حركة السعر نظرنا في قياس الحجم عن طريق مذبذب باستخدام اثنين من المتوسطات المتحركة. في هذه المقالة ، نلقي نظرة على معدل حجم التغيير (V-ROC) ، وسنركز على أهمية تحركات الأسعار وحجمها في دراسة اتجاهات السوق.
في العقد الماضي ، شهدنا تقلبات ثلاثية الأرقام على مؤشر داو جونز الصناعي في الاتجاه الصعودي والجانب السلبي على حد سواء. ربما لم يدرك الوافد الجديد إلى علم التحليل الفني أن بعض هذه التحركات كانت تفتقر إلى الاقتناع ، لأن الحجم لم يكن دائمًا يدعم حركة السعر. لا يهتم اختصاصيو الخرائط على الأقل بحركة من 5 إلى 10٪ في سعر السهم إذا كان الحجم الذي يحرك السعر جزءًا صغيرًا من الحجم اليومي المعتاد لهذه المشكلة بعينها. من ناحية أخرى ، نظرًا لأن حجم سوق ناسداك يصل أو يتجاوز ملياري سهم يوميًا ، فإن تحركات الأسعار المهمة ستثير اهتمام المحللين. إذا كانت حركات الأسعار أقل بكثير من 5 إلى 10٪ ، فقد تذهب أيضًا إلى لعب الجولف.
حجم مؤشر الاتجاه
معدل حجم التغيير هو المؤشر الذي يوضح ما إذا كان اتجاه الحجم يتطور في اتجاه صعودي أو هبوطي. قد تكون على دراية بمعدل سعر التغيير (تمت مناقشته هنا) ، والذي يوضح للمستثمر معدل التغيير الذي تم قياسه بسعر إغلاق الإصدار. لحساب ذلك ، تحتاج إلى تقسيم تغيير حجم الصوت على فترات n الأخيرة (أيام أو أسابيع أو أشهر) على وحدة التخزين منذ فترات. الجواب هو تغيير النسبة المئوية للحجم على فترات n الأخيرة. الآن ماذا يعني هذا؟ إذا كان حجم التداول اليوم أعلى من n-day (أو أسابيع أو أشهر) قبل ذلك ، فسيكون معدل التغيير هو رقم زائد. إذا كان حجم الصوت أقل ، فسيكون رقم ROC ناقصًا. يسمح لنا ذلك بالنظر إلى السرعة التي يتغير بها مستوى الصوت. (لمعرفة المزيد حول قوة الاتجاه ، راجع ADX: مؤشر قوة الاتجاه.)
إحدى المشكلات التي يواجهها المحللون في V-ROC هي تحديد الفترة الزمنية لقياس معدل التغيير. على سبيل المثال ، ستظهر لنا فترة أقصر من 10 إلى 15 يومًا القمم التي أحدثها التغيير المفاجئ ، ويمكن رسم خطوط الاتجاه في معظم الأحيان. لإلقاء نظرة أكثر واقعية ، أود أن أقترح استخدام فترة 25 إلى 30 يوما ؛ هذا طول الوقت يجعل الرسم البياني يبدو أكثر تقريبًا وسلسًا. تميل الفترات الأقصر إلى إنتاج مخطط أكثر خشنة ويصعب تحليله.
aistikhdam h
Chart Created with Tradestation
In the chart of the Nasdaq Composite Index, you can see a classic sell-off with the V-ROC reaching a high of 249.00 on December 13, 2001 (based on a 14-day period). In fact, if you study the chart closely, you can see that the ROC becomes positive for the first time on Dec 12, 2001, with a measurement of 19.61. On the next day the measurement jumps to 249.00 on the closing. The Nasdaq, however, had a high of 2065.69 on December 6 (ROC, +8.52) and then fell to negative numbers until December 12. By using a 14-day period, we cannot recognize this slide until the Index loses 119.18 points (approx. 6.5%) to the level of 1946.51. This would confuse most, were it not for the ability to change our period of time, in this case, to a 30-day period, shown in Figure 2.
Figure 2: Volume Rate of Change - 30-Day Period
Chart Created with Tradestation
In the second chart of the Nasdaq Composite Index, which uses a 30-day period, you can clearly see that in and around December 12 and 13, 2001, the ROC barely shows a positive number, and it is not until January 3, 2002 that a positive number appears, as the price action rises substantially from 1987.06 to 2098.88. On the ninth of the month, there is a move to the upside of 111.82 points. This positive value means there is enough market support to continue to drive price activity in the direction of the current trend. A negative value suggests there is a lack of support, and prices may begin to become stagnant or reverse.
We can see that even with a 14-day period, the V-ROC over the year shown on this chart, for the most part, moves quietly above and below the zero line. This indicates that there is no real conviction for there to be a trending market. The only real jump in price action that most investors missed is the move in late July, occurring over a period of five trading days, which, as you can see in the chart, has given almost everything back. Another interesting point is the lack of volume behind the price action as it moves upward. This is evident in the period from August 5, 2002, when the Nasdaq closed at 1206.01, to Aug 22, 2002, when the index closed at 1422.95. During this time, the V-ROC remained negative, indicating to all technical analysts that the increasing price in the index would not hold.
The Bottom Line
Using the previous volume indicators, you can confirm price movements that have conviction and avoid buying or selling based on blips in the market that will soon be corrected. Watch the volume, and the trends will follow. Remember it's your money - invest it wisely.
Compete Risk Free with $100,000 in Virtual Cash
Put your trading skills to the test with our FREE Stock Simulator. Compete with thousands of Investopedia traders and trade your way to the top! Submit trades in a virtual environment before you start risking your own money. Practice trading strategies so that when you're ready to enter the real market, you've had the practice you need. Try our Stock Simulator today >>
aistikhdam ح
تم إنشاء الرسم البياني باستخدام Tradestation
في الرسم البياني لمؤشر Nasdaq Composite Index ، يمكنك أن ترى عمليات بيع كلاسيكية مع وصول V-ROC إلى 249.00 في 13 ديسمبر 2001 (على أساس فترة 14 يومًا). في الواقع ، إذا كنت تدرس الرسم البياني عن كثب ، يمكنك أن ترى أن ROC تصبح إيجابية لأول مرة في 12 ديسمبر 2001 ، بقياس 19.61. في اليوم التالي ، يقفز القياس إلى 249.00 عند الإغلاق. ومع ذلك ، كان مؤشر ناسداك مرتفعًا عند 2065.69 في 6 ديسمبر (ROC ، +8.52) ثم انخفض إلى أرقام سالبة حتى 12 ديسمبر. باستخدام فترة 14 يومًا ، لا يمكننا التعرف على هذه الشريحة حتى يخسر المؤشر 119.18 نقطة (تقريبًا 6.5 ٪) إلى مستوى 1946.51. هذا من شأنه أن يربك أكثر ، لولا القدرة على تغيير الفترة الزمنية لدينا ، في هذه الحالة ، إلى فترة 30 يومًا ، كما هو موضح في الشكل 2.
الشكل 2: معدل حجم التغيير - فترة 30 يوما
تم إنشاء الرسم البياني باستخدام Tradestation
في الرسم البياني الثاني لمؤشر Nasdaq Composite Index ، والذي يستخدم فترة 30 يومًا ، يمكنك أن ترى بوضوح أنه في وحول 12 و 13 ديسمبر 2001 ، بالكاد يظهر ROC رقمًا إيجابيًا ، ولم يستمر حتى 3 يناير 2002 يظهر هذا الرقم الإيجابي ، حيث ارتفعت حركة السعر بشكل كبير من 1987.06 إلى 2098.88. في التاسع من الشهر ، هناك تقدم نحو 111.82 نقطة. تعني هذه القيمة الإيجابية وجود دعم كافٍ للسوق لمواصلة دفع نشاط السعر في اتجاه الاتجاه الحالي. تشير القيمة السلبية إلى عدم وجود دعم ، وقد تبدأ الأسعار في الركود أو الانعكاس.
يمكننا أن نرى أنه حتى خلال فترة 14 يومًا ، يتحرك مؤشر V-ROC على مدار العام المبين على هذا الرسم البياني ، في معظمه ، بهدوء فوق وتحت خط الصفر. يشير هذا إلى عدم وجود قناعة حقيقية بوجود سوق متجه نحو الارتفاع. القفزة الحقيقية الوحيدة في حركة الأسعار التي فاتها معظم المستثمرين هي الحركة في أواخر يوليو ، والتي تحدث على مدى خمسة أيام تداول ، والتي ، كما ترون في الرسم البياني ، أعادت كل شيء تقريبًا. النقطة المهمة الأخرى هي قلة الحجم وراء حركة السعر حيث يتحرك صعودًا. هذا واضح في الفترة من 5 أغسطس 2002 ، عندما أغلق مؤشر ناسداك في 1206.01 ، إلى 22 أغسطس 2002 ، عندما أغلق المؤشر في 1422.95. خلال هذا الوقت ، بقيت V-ROC سلبية ، مما يشير إلى جميع المحللين الفنيين أن السعر المتزايد في المؤشر لن يصمد.
الخط السفلي
باستخدام مؤشرات الحجم السابقة ، يمكنك تأكيد تحركات الأسعار التي لديها قناعة وتجنب الشراء أو البيع على أساس التذبذب في السوق الذي سيتم تصحيحه قريبًا. مشاهدة حجم ، وسوف تتبع الاتجاهات. تذكر أنها أموالك - استثمرها بحكمة.
منافسة خالية من المخاطر مع 100،000 دولار في النقدية الافتراضية
ضع مهاراتك في التداول من خلال محاكي الأسهم المجاني. تنافس مع الآلاف من متداولي Investopedia واستبدل طريقك إلى القمة! يمكنك تقديم صفقات في بيئة افتراضية قبل أن تبدأ في المخاطرة بأموالك الخاصة. مارس استراتيجيات التداول بحيث تكون مستعدًا للدخول إلى السوق الحقيقية ، حيث تكون لديك الممارسة التي تحتاجها. جرب سهم Simulator اليوم >>

التعديل الأخير:

