الشموع تنير تداول الحائرين الخاسرين ...و َ المتوهقين َ


post_old.gif
09-06-2013, 04:47 AM
justice
user_online.gif

عضو

تاريخ التسجيل: Oct 2009
المشاركات: 4,963

icon1.gif

تصدقون عاد ... الرجل الفذ اللي بدأ بالجهود الاولى لتأسيس هذا الابتكار العظيم - الشموع - تدرون شسووا فيه ..... حطوه وزير لأ ...أعدموه .........نعم أعدموه ...لا مافي غلط بالكتابة ....صدمة ها ... ديروا بالكم لحد يبتكر شي تبون تعرفون ليش أعدموه ....لان المجدي ما يحب المجدي ياجماعة قصة نشأة الشموع اليابانية.......ما تطوف خل انقلها لكم تفضلوا ................ الخلفية التاريخية لنشأة الشموع اليابانية‏ في بداية القرن السادس عشر تم توحيد المقاطعات اليابانية في حكومة عسكرية مركزية بقيادة ثلاثة من القادة اليابانيين هم "نوبو ناجا" و "هيدي يوشي" و" إياسو توكوجاوا"،و قد حكمت أسرة القائد الثالث اليابان لمدة تزيد عن 150 سنة اليابان في عصر سمي بـ"عصر أسرة العقيد توكوجاوا ." و أثر الوضع العسكري الذي استمر لمدة طويلة في حياة اليابان وفي لغتها، لذا تجد أن الكثير من أسماء الشموع لها مسميات عسكرية أو شبه عسكرية مثل الهجمات الليلية و هجمات الصباح و الفدائيين الثلاثة و خطوط الهجوم المضاد و غيرها الكثير من الأسماء ،


ومن نتائج الحكم العسكري المركزي لهذه المدةالطويلة من الزمن نما الاقتصاد الزراعي، و توسعت الحركة التجارية الداخلية ،و نشأت الأسواق الوطنية بدلاً من الأسواق المحلية المعزولة،

ونتيجة لوجودالسوق المركزي نشأ التحليل الفني الياباني ،وفي ذلك الزمان أصبحت "أوساكا" عاصمة اليابان الاقتصادية، ومركز التجارة لها، وذلك لقربها من البحر، وأصبحت محطة لتجميع و توزيع المؤن.
تاجر الحرب الياباني "يودويا كي يان" الذي كان يعمل لصالح القائد "هيدي يوشي"كان له قدرة خارقة في نقل و توزيع و تسعير الأرز و كانت لمخازنه من الأهمية لدرجة أن أول بورصة للأرز نشأت كانت في هذه المخازن،

ورغم أنه كان تاجرحرب و يعمل لحساب الحكومة العسكرية، و لكن لا أمان مع العسكر تمت مصادرةأمواله، واتهامه بالرفاهية التي لا تناسب طبقته الاجتماعية، وتمت المحاكمة والاعدام لصاحب أول بورصة للسلع في العالم .
نشأت بورصة "دوجيما للأرز "في "أوساكا" في أواخر القرن السابع عشر، و تم تطويرها و تنظيمها و بدئت التجارة بالأرز الحقيقي، و في العام 1710 بدء التعامل بايصالات استلام خاصة بمخازن الأرز و هذه كانت أول عقود آجلة في التاريخ . كان الإقطاعي الذي يحتاج للمال يرسل الأرز الفائض عن احتياجه لمخازن أوساكا ويأخذ ايصال للأرز و يمكنه بيع هذه الايصالات متى يريد . بذلك أصبحت بورصة دوجيما أول بورصة للعقود الآجلة في التاريخ، و وصل حجم هذه البورصة في عام 1749 إلى 110.000 بالة أرز في وقت كان الانتاج الكلي للدولة 30.000 بالة . ........................................ تدوينٌ:- ShaiMaa Gaber منقوله من موقع http://yalla-nbda2.blogspot.com/ مع الشكر و التقدير لهم على هذه المعلومات القيمة **************** خوش حزاية ..ها.... ترى باقي جزء بسيط ..................... انتظرونا .....لا تذهبون بعيدا ..........
1250733069.jpg


post_old.gif
18-06-2013, 03:32 PM
justice
user_online.gif

عضو

تاريخ التسجيل: Oct 2009
المشاركات: 4,963

icon1.gif

images


في عام 1750 بدء التاجر الياباني "مونيهيسا هوما" Munehisa homma إدارة تجارة أسرته الثريةالتي كان ثرائها مضربا للأمثال من بورصة ساكاتا المحلية و إلى هوما تعودكثير من قوانين التجارة المسماة قوانين ساكاتا و من هذه البورصة المحليةانطلق الى بورصة دوجيما للأرز في أوساكا و بدء تجارة عقود الأرز الآجلة .
Munehisa homma قام هوما بعمل سجلات سنوية لأحوال الطقس، و كان على اظلاع بأخبار سوق الأرز ،

و قام بتحليل أسعار الأرز تاريخيا من عصره، حتى بورصة الرز التي كانتموجودة في مخازن "يودويا"، كما قام بانشاء نظام اتصال خاص بينه و بين مزارعالأرز الخاصة به و بعائلته من "أوساكا" حتى "ساكاتا"، وبعد أن هيمن على أسواقأوساكا اتجه هوما إلى بورصة إدو و هوه اسم طوكيو القديم و بدء التجارة بها،

و أصبح هوما مستشارا ماليا في الحكومة اليابانية و منح لقب ساموراي، و توفيعام 1803 و مبادئ هوما التجارية التي طبقها في تجارة الأرز تطورت لتمنحناأسلوب الشموع اليابانية المستخدم حاليا...


انتهى

تدوينٌ:- ShaiMaa Gaber
منقوله من موقع http://yalla-nbda2.blogspot.com/
مع الشكر و التقدير لهم على هذه المعلومات القيمة


.......................................
........................
.......................................

و توتة توتة توتة و لا تخلص الحدوته


post_old.gif
05-07-2013, 11:39 AM
justice
user_online.gif

عضو

تاريخ التسجيل: Oct 2009
المشاركات: 4,963

icon1.gif

لى الحين محنا عارفين شسالفة..انزين شمالته و وين في يستخدمونها ..شموع يابانية..شي خاص فيهم ...إحنا شكو ...

الشموع اليابانية هي وسيلة أو أداة تستخدم لقياس نشاط السوق و اتجاهاته المتوقعه....

و
الوسيلة أو الأداة تستخدم في اي مكان ..مثل ميزان الحرارة و التلفون و الكاميرا


ببساطة هي رسم بياني ...و لكن مطور ...


LINE%20CHART_SHARTAT%281%29.gif

image001.jpg


رسم بياني معتاد


خط الرسم البياني كما هو واضح في الرسم هو مقياس لموضوعا ما....متى بدأ و اين موقعه و كيف سار اتجاهه

و لكن ان اردت التفاصيل فعليك الرجوع للبيانات الموجودة في السجلات ...
فإن اردت بيانات شهرية فعليك ان ترجع لبيانات كل شهر ..إن اردت بيانات يومية فعليك ان ترجع لبيانات كل يوم

فنظرا لطبيعة المتاجرة بالسلع الغذائية التي تتطلب السرعة و الحركة و النقل و تقلب الاسعار و تداول التجار ...فقد ابتكر اليابانيون اداة رمزية على شكل نموذج يبين البيانات الاساسية مثل سعر الافتتاح و اعلى سعر وصله التداول و ادنى سعر و هل كان السعر صاعدا ام هابطا

و جعلوا النموذج يتشكل وفقا لتلك البيانات .....


%D8%A7%D9%84%D8%B4%D9%85%D9%88%D8%B9-%D8%A7%D9%84%D9%8A%D8%A7%D8%A8%D8%A7%D9%86%D9%8A%D8%A9-2.jpg


شكل النموذج ...و اسموه شمعة تشبها بشكلها


-


post_old.gif
03-07-2014, 10:35 AM
justice
user_online.gif

عضو

تاريخ التسجيل: Oct 2009
المشاركات: 4,963

icon1.gif


أوجه تشكل نماذج الشموع اليابانية
_____________________


اولا : الصعود و النزول
------------------------

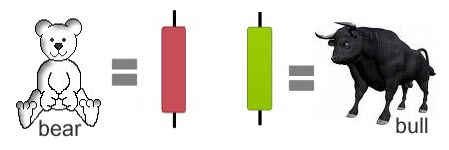
اذا السعر صاعد يكون لون النموذج - الشمعة - اخضر
اذا السعر نازل يكون لون النموذج - الشمعة - احمر

و كما هو مبين ادناه :

%25D8%25A7%25D9%2584%25D8%25AB%25D9%258A%25D8%25B1%25D8%25A7%25D9%2586.jpg


سهله ..ها...
شمعة خضراء يعني صعود..ارتفاع..فوووق ..مشلع ...مدرعم ..أناسة ..فرحة ..بأشتري سارة..باشتري بيت ..
#هوب هوب..موعلى كيفك (منو اللي يقول هالكلام مادري؟)

شمعة حمراء يعني نزول ..هبوط...تحت ..جري..متلخلخ..منيل بستين نيلة ...قلقة..تحلطم ..تبرطم ..ليش الغدى متأخر اليوم ..ها ..ليش؟؟؟ - مع انه مو متأخر ولا شي -
#هي ..مو تقعد تطلع حرتك فينا....(منو اللي يقول هالكلام مادري؟)


و نتوقف عند هذا الحد ...حبة حبة

و نردد إغنية لصانع السوق
شمعة خضره و لوجبر خاطر... و لو تعليقة من بعيد

و انشاء الله تكون حياتكم كلها شموع خضراء


الصور من

www.shartat.com
www.forex4arabs.com
-yalla-nbda2.blogspot.com


-------


كفي الملامَ وعلليني فالشك أودى باليقينِ
....وتناهبت كبدي الشجون فمن مجيري؟ مِن شجوني
.........وأمضني الداء العياء فمن مغيثيي؟ من معيني؟
.............أين التي خلقت لتهواني وباتت تجتويني
.........................الله يا أماه فيَّ ترفقي لا تعذليني
أرهقتِ روحي بالعتاب فأمسكيهِ أو ذريني
شاعر الكويت الكبير فهد العسكر


الكويت امتداد لملحمة وطنية شعبية من نور ..و لن يفلحوا في تغيير ذلك
سوف تعود ...


لي مواضيع أخر
__________
هل يمكن ان يكون للانسان علامة تجارية يسوق بها قدراته الفكرية و مهاراته٠٠و مردود ذلك عالميا ٠٠تفكير غريب٠٠صح

> أكو حكومة تعلم و تدرب أبنائها ثم تدفع لهم مزايا لتشجيعهم على التقاعد = حبيبي..بتسوي مخزن العقول ..شفهمك إنت

حمود الزيد الخالد ** حكمة في رجل

لي رأي و رؤى


شرايك نقرأ عن التحليل الفني ..._ لا تضيع و قتك ما منه فايده موليه..

" إنهم بحارة إلى النخاع ورجال لا يعرفون الزيف " - بحرية الكويت - روح الكويت و سيرتها العطره

تبي تقرأ عن الشموع اليابانية ؟.. لأ صج تبي و لأ ؟...إحلف ..


post_old.gif
18-08-2014, 07:10 AM
justice
user_online.gif

عضو

تاريخ التسجيل: Oct 2009
المشاركات: 4,963

icon1.gif

تابع / أوجه تشكل نماذج الشموع اليابانية


بعد أن عرفنا ان الشمعة الخضراء تعني صعود و الحمراء تعني نزول نبين الآن شلون نعرف من الشموع أسعار الافتتاح و أسعار الاغلاق


ثانيا : أسعار الافتتاح و أسعار الاغلاق
------------------------


%25D8%25A7%25D9%2584%25D8%25AB%25D9%258A%25D8%25B1%25D8%25A7%25D9%2586.jpg


الحين لما نقول صعود ...نعني ان صعود المؤشر أو السهم من سعر الافتتاح
و بالتالي
فإن الشمعه تكون في اتجاه يبدأ من سعر الافتتاح الى الاعلى

أي أن شمعة الصعود الخضراء الحد السفلي فيها يمثل سعر الافتتاح و الحد العلوي يمثل سعرالاغلاق


و بالعكس بالنسبة لشمعة النزول الحمراء

لما نقول نزول...نعني نزول المؤشر أو السهم عن سعر الافتتاح الى اسفل ...
و بالتالي
فإن شمعة النزول تكون في اتجاه معاكس يبدأ من حد سعر الافتتاح الى اسفل

اي ان الشمعه الحمراء الحد السفلي فيها يمثل سعر الاغلاق و الحد العلوي يمثل سعرالافتتاح


انزين و الخط اللي طالع من فوق و من تحت - و كأنه قلمه او عود كبريت

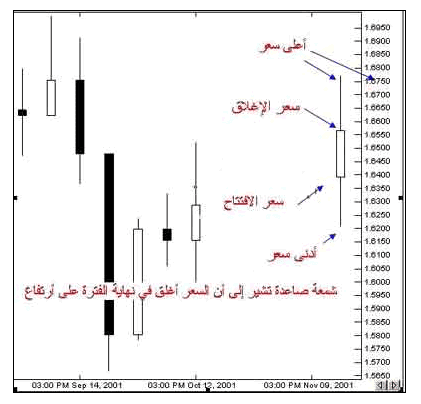
الخط الظاهر اعلى الشمعه يشير الى اعلى سعر بلغه المؤشر او السهم أثناء فترة التداول
و

الخط الظاهر اسفل الشمعه يشير الى ادنى سعر بلغه المؤشر او السهم أثناء فترة التداول


و لما كان كل ذلك و مما تقدم من الموضوع فإن الشمعه تكون حتى الآن قد بينت لنا ما يلي
عن حركة المؤشر / السهم في يوم تداول واحد ..


وضع الصعود
وضع النزول
سعر الافتتاح
سعر الاغلاق
اعلى سعر
ادنى سعر


عجيب !!!....
يه وينك ماشفت شي .. في بعد شمعة اسمها ماربوزو
مالبورو
تفضل الاخ عباله تتن


post_old.gif
10-10-2014, 11:07 PM
justice
user_online.gif

عضو

تاريخ التسجيل: Oct 2009
المشاركات: 4,963

icon1.gif

هب يالهيابانيين ..داخلين حتى بالاسهم...احنا عبالنا ان شغلهم بالسيارات و الأجهزة الالكترونية.....

انزين وين في مكان هالشموع ..............


مكان استخدام الشموع
--------------------------

مكان الشموع هو الرسم البياني و هذا هو شكل رسم بياني عادي


و ها هو رسم بياني استخدمت فيه الشموع بدل الخط


خنشوفها بشارت ملون شغل عدل مدل.... مو شارت اسود و ابيض مال الستينات ....وين قاعدين في

و هو بالمناسبة شارت السوق الكويتي في يوم 7 / 3 / 2013
يعل الله يمد في ارتفاعاته


chart.aspx


هاهي الشموع و قد أخذت مكانها و حلت مكان خط الرسم البياني شمعه جنب شمعه ....

و كل شمعه تبين المعلومات الاساسية اللي تكلمنا عنها.............

و فيما يلي نموذج مقرب يوضح كيف تبين لنا الشمعة المعلومات الاساسية -
سعر الافتتاح و الاغلاق
و
أعلى و أدنى حد وصل له المؤشر


04mar02.png


انزين الشموع ما تصير الا يومية.....ما تصير شهرية او سنوية

امبلى ..و تصير بعد أقل من يوم واحد ...ممكن تكون ساعة أو حتى 10 دقايق ...
كيفك ..انت اللي تحدد الوقت
انت تامر و الشمعه تلبي


Japanese-Candle-Stick-Trader-iStock_000011858426XSmall.jpg


الشموع تتكون لتنير طريق التداول ,,,,,,,,,,,,
----------------------------
ضاقت بي الدنيا دعيني أندب الماضي دعيني
....وأنا السجين بعقر داري فاسمعي شكوى السجين
.................بهزال جسمي باصفراري بالتجعد بالغضون
.........وطني وما أقسى الحياة به على الحر الأمين
...وطني وما أقسى الحياة به على الحر الأمين
.. وألذ بين ربوعه من عيشتي كأس المنون
شاعر الكويت الكبير فهد العسكر
الكويت امتداد لملحمة وطنية شعبية من نور ..و لن يفلحوا في تغيير ذلك
سوف تعود ...
لي مواضيع أخرى
الكويت التى ما عرفت منذ وجدت إلا الحرية والكرامة ..عبدالله السالم - مؤسس الدولة
حمود الزيد الخالد ** حكمة في رجل
إنذار الطبيعة الاول .. مفاعل بوشهر النووي و ....البيئه و...الكويت و...اهل الكويت
الاهتمام بالبيئه أولويه قصوى في العالم فماذا عن الكويت..ماذا عن الكويت..ماذا عن الكويت ؟؟!!!؟؟
هل تدركون الاضرار التي تصيبكم نتيجة سوء ادارة الحكومه........فكروا ...
يا هامور قولي رايح على فين ــ يا هامور قولي أصيدك فين :: للحداقه بس..ها


الرسوم البيانية
من
www.w-tb.comwww.saary-sa.com


post_old.gif
18-01-2015, 09:51 PM
justice
user_online.gif

عضو

تاريخ التسجيل: Oct 2009
المشاركات: 4,963

icon1.gif

هذه الشموع ....صج ... يه..يه...

و احنا عبالنا لوغاريتمات و جذر تربيعي...و ...h2o !! لأ h2o جنهه فيزيا

انزين الحين نبي خلاصة هالشرح اللي طاف


خلاصة ما تقدم شرحه
------------

هذا هو شكل الشمعة اليابانية

%25D8%25A7%25D9%2584%25D8%25AB%25D9%258A%25D8%25B1%25D8%25A7%25D9%2586.jpg


- الشمعة هي نموذج مستطيل يبرز في أعلاه خط صغير الى الاعلى و في اسفله يبرز خط صغير الى الاسفل

الشمعه / المستطيل الاخضر
---------------

- اللون الاخضر يرمز الى الصعود .........
- الحد السفلي في المستطيل الاخضر هو سعر الافتتاح ...و الحد العلوي في المستطيل الاخضر هو سعر الاغلاق
- الخط المستقيم العلوي البارز في المستطيل الاخضر يبين أعلى سعر وصل اليه المؤشر او السهم اثناء التداول
- الخط المستقيم السفلي البارز في المستطيل الاخضر يبين أدنى سعر وصل اليه المؤشر او السهم اثناء التداول


الشمعه / المستطيل الاحمر
-------------

- اللون الاحمر يرمز الى الهبوط ....
- - الحد العلوي في المستطيل الاحمر هو سعر الافتتاح ...و الحد السفلي في المستطيل الاحمر هو سعر الاغلاق
- الخط المستقيم العلوي البارز في المستطيل الاحمر يبين أعلى سعر وصل اليه المؤشر او السهم اثناء التداول
- الخط المستقيم السفلي البارز في المستطيل الاحمر يبين ادنى سعر وصل اليه المؤشر او السهم اثناء التداول

- زمن تكون الشمعه يحدده مستخدم هذا النوع من التحليل ..قد يكون مثلا.. 5 دقائق او 10 دائق او ساعه او يوم او شهر ....


و هكذا يكون شكلها على الشارت


chart.aspx


بس.... ها ذي الشموع !!

لأ طبعا...
هذه بداية بسيطة تأسيسية و هناك الكثير من التفاصيل حول تشكل الشموع و أنماطها و دورها في التحليل الفني و في تحديد اتجاه المؤشر او السهم المتوقع .....
ذلك كان بمثابة بناء القاعدة الاساسية في البيت ..و بعدها يتم تركيب باقي أجزائه

انزين انا قاعد اشوف في الشارت شموع عصله مسحوته و بعضها متقرفضه فوق بردانة مادري شقصتها و بعضها الطول طول نخلة و العقل عقل ..

شسالفة ...شنو معنى هالاشكال

وليه .. الظاهر ماراح ماراح نخلص..من حرك بلش ..

شتقول ...؟
أقول ...هذا هو موضوعنا القادم راح نشرح انواع تشكل نماذج الشمعه و ماذا تعنيه
.......................
..........
...................


بساطتها ....دقتها...أشكالها... فوائدها
شيء مش معقول ...
شيء خل الدنيا زهور على طول
وشموع على طول
الصورة من
yalla-nbda2.blogspot.com
شعر محور ليكون بورصويا


-----------------------------
....................وطني وأدت بك الشباب وكل ما ملكت يميني
............وقبرت فيك مواهبي واستنزفت عللي شؤوني .......ودفنت شتى الذكريات بغور خافقي الطعين ..وكسرت كأسي بعدما ذابت بأحشائي لحوني
شاعر الكويت الكبير فهد العسكر


لي مواضيع أخرى
إذا
لكم خلق للقراءة ..
حمود الزيد الخالد ** حكمة في رجليوميات متداول ........
أنا و الافكار و الدنيا ... ... .... و لا يُنبيكَ عَن خُلُقِ اللَيالي ** كَمَن فَقَدَ الأَحِبَّةَ وَالصَحابا ‏(
multipage.gif
1 2) الاهتمام بالبيئه أولويه قصوى في العالم فماذا عن الكويت..ماذا عن الكويت..ماذا عن الكويت ؟؟!!!؟؟ هل تدركون الاضرار التي تصيبكم نتيجة سوء ادارة الحكومه........فكروا ...
سالفه كويتية .... من الديرة التي تم مسحها من على وجه الارض

 
شلون تشكل الشموع ؟؟


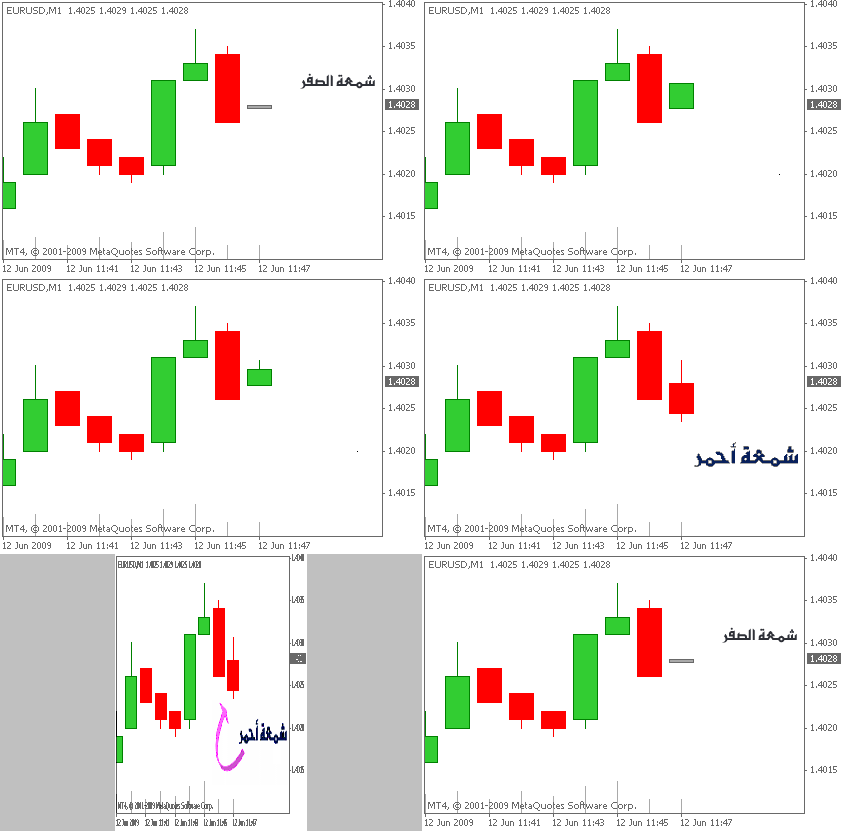
أول بداية تشكل الشمعة تكون على شكل خط >>> "" _ "" و يسمونها الشمعة الصفرية

فإذا ما كان سعر السهم مرتفعا تتشكل الشمعة و تمتد إلى أعلى الخط
و إذا ما كان سعر السهم منخفضا تتشكل الشمعة و تمتد إلى أسفل الخط

هذا رسم كافي و وافي يوضح كيف تتشكل

تمقلوا فيه عدل .. على ما نستكمل إعداد الجزء القادم من الشرح

يونس هاااا...


المصدر
http://currenciestrad.blogspot.com/p/hga.html


عسى ما يسحبونه :)
 
التعديل الأخير بواسطة المشرف:
لا يغرك شراعه ترى اهو عليمي ....

قريت كلمتين و قاعد اتشيحط يكون يعني جايب الديب من ديله


بالنسبة للشموع لي رأي فيهم يتمثل فيما يلي :

1 - اليابانيين هم من ابتكر الشموع ..و اليابانيين عندهم مسائل الاخلاص في العمل و الدقة و التعلم و الابتكار عقيدة مقدسة مقدمة على اي امر آخر في الحياة .. و لا بد أن هذه الصفات مأخوذه في الاعتبار عند من ابتكرها ....

2 - هناك بالتأكيد فلسفة عميقة وراء مفاهيم و أشكال الشموع لم نتعرف إلا على اليسير منها ....

3 - نظام الشموع كان يستخدم في تجارة الارز المزدهرة و الصاخبة حينها .. لذا فإنه كان معبرا بصدق و بثقة عن مسار سوق الارز و الا لما وثقوا به تجاره

4 - الجيش كان يحكم اليابان ...و بالتأكيد كان الجيش الياباني بصرامتة و قسوته حاضرا بلاشك في ذهن من إبتكر نظام الشموع .. فالفشل في تطبيقه قد يعني الاعدام .. لذلك فهو نظام محكم متكامل ..

5- مع الاسف لا توجد كتب يابانية عن الشموع مترجمة الى اللغة العربية .. و ماهو موجود على النت هو كتب تعبر عن فهم من كتبها لا عن المفاهيم اليابانية لنظام الشموع

6 - هي أصدق أنواع النظم الفنية .. لماذا .. لإنها تعكس ارقام التداول الحقيقية .. و هذا ما يتطابق مع اطروحات داو حول قواعد عمل الاسواق المالية علما بأنهم قد سبقوه بمائتي سنه

7 - كلما قرأت عنها كلما تبين لك أنك في البدايات ... و لم تسبر أعماقها و فلسفتها ..


8 - فيها فرصة لمن يجيد التفكر و التدبر و لمن لديه ملكة الخيال أن يطوع بعض مفاهيمها في فتح آفاق شخصيه له تفيده في الارتقاء بمستوى تداولاته


-​
 
التعديل الأخير:
عائلة دوجي العريقة
==============


Doji


Doji هي شمعة صغيرة سعر الأفتتاح بها هو نفس سعر الأغلاق متساوين الا اننا يمكننا ابداء بعض المرونة في تطبيق هذا الشرط اذا جاء الفرق بين الفتح والأغلاق بضعة نقاط أو ربع نقطة يمكننا أيضا اعتبارها دوجي كما هو موضح بالمثال :


شمعة الدوجي Doji هي شمعة هامة تشير الي أن الأتجاه قد يتغير قريبا ,عند ظهور هذه الشمعه فالسوق لا يعرف الي أين يتجة هي مرحلة الا اتجاة . تكون شمعة الدوجي شمعة انعكاسية اذا ظهر معها بعض أنماط الشموع الأخري التي تدعم تغير الأتجاه فتكون شمعة الدوجي في هذه الحالي شمعة أنعكاسية , ولكن يتوقف تأثيرها علي مكانها ولكن علي أي حال من الأحوال اذا رأيت هذه الشمعة لا تتجاهلها .


Doji عند القمم :

عند ظهور شمعة الدوجي علي قمة السوق ويكون اليوم السابق يوم صاعد حاد فهي تمثل التردد في السوق ,والعكس اذا ظهرت شمعة الدوجي أدني قاع السوق بعد ترند هابط ويكون اليوم السابق هابط فهي تمثل تردد أو عدم اليقين بوجود اتجاه معين أو انحصار المشترين عن الشراء والأنتظار لمعرفة ما اذا كان سلوك السوق سوف يستمر صعودا أم سيتغير .


كما هو موضح بالمثال ظهور شمعة الدوجي بعد يوم صاعد في الأسفل أيضا مثال يوضح ذلك علي الشارت .


الشمعة رقم واحد ظهرت بعد هبوط في اليوم السابق تكونت بعدها شموع ذات أذيال طويلة وهذا يدل علي حيرة الدببه والثيران هل سيكمل هبوطا ام سيتغير الأتجاة ! صعد السعر بعدها صعودا حادا وكون أيضا في القمة عند الشمعة رقم 2 وبعد الدوجي كون شموع ذات أذيال طويلة وبدأ في الهبوط مره أخري بدأ السعر في الأرتفاع مره أخري وارتفع في يوم واحد أرتفاع حاد وظهرت شمعة الدوجي 3 فهبط السعر مره أخري ولكن لم يكسر القاع وبدأ السعر في الصعود في الترند الهابط حتي ظهور شموع الدوجي رقم 4 ولكن هل هبط السوق بعدها مباشرة ؟ بالطبع لا وهذا يبين لك أن لا يجب عليك ان تنتظر حين ظهور الشموع الأنعكاسية أن يتغير أتجاة السوق مباشرة ولكن خذها كأشارة انعكاسية وبالأخص مع شموع الدوجي لأنها شموع تبين الحيره وعدم اليقين أكثر منها شموع أنعكاسية . والمثال 4 يوضح ذلك ظهرت الشموع وبدأ السوق في الأرتفاع مره أخري ولكن ليس كثيرا حتي ما ظهرت شمعة الدوجي رقم 5 وهبط السوق مره أخري هبوط حاد وحتي تفهم معني ظهور الدوجي بعد هبوط أو صعود حاد أنظر الي الشمعة رقم 6 ظهرت بعد يوم هابط حاد وانعكس السعر بعدها مباشرة صعودا مغيرأ اتجاه الي ترند صاعد .


في هذا المثال نري ظهور شموع الدوجي بعد ترند هابط اليوم السابق يوم أحمر هابط قوي وظهرت شمعة الدوجي لتعكس سلوك السوق , وهنا سلوك السوق هو التردد عدم التأكد هل سيكمل السوق صعودا ام سيهبط , يتأكد تغير الأتجاه بكسر قمة شمعة الدوجي "عند الخط الأسود" , حين تم اختراقها نري أن السوق قد امتد صعودا وتغير الأتجاه بالفعل .


مثال أخر يوضح ان شمعة الدوجي تعمل أيضا لأشارة تنبيه ان الأتجاه قد يتغير , هذا المثال يوضح لك انه لا يجب ان يتغير الأتجاه الي ترند هابط مباشرة بعد ظهور شمعة الدوجي من المره الأولي , قد تظهر شمعة الدوجي ويدخل السوق في موجة عرضية تستمر لأسابيع بل لشهور قبل ان يتغير اتجاه السوق تماما .


في الشمعة رقم 1 ظهرت علي قمة جديدة , عندما تري شمعة مثل هذه لا يمكنك أن تتجاهلها واستخدمها كأداة تحذير انتبة السوق قد يتغير . هبط السوق قليلا وبعدها ظهرت الشمعة رقم 2 والشمعة رقم 2 تؤكد لك التحذير عليك ان تفهم بعد ظهور قاع أدني من قاع وظهور هذه الشمعة مره أخري أن السوق سوف يتغير اتجاهه قريبا , تحرك السوق بطريق عرضي لفترة تعدت العشر أسابيع تقريبا وظهرت بعدها شمعة دوجي 3 وبعد ظهور هذه الشمعة أنهار السوق مباشرة .

اذن كيف يمكنني أن أستخدم هذه الشمعة Doji ؟

1 - استخدمها كأداة تحذيرية تحذرك من ان السوق قد يتغير أتجاه

2- لا تعتمد علي هذه الشمعة وحدها ولكن ادمجها مع أنماط أخري قد تظهر أو ظهرت بالفعل وسوف نشرحها في أمثله قادمة , عند ظهور هذه الشمعة يمكنك أن تغلق بعض الربح من عمليتك وتحرك وقف خسارتك فأنت بهذه الطريقة لبيت التحذير .


Long Legged Doji & Rickshaw Man


الدوجي طويلة السيقان هي دوجي هامة جدا عند القمم . كما سوف نوضح في الشكل القادم , فان هذه الشمعه يكول ظليها العلوي والسفي طويلان وهو ما ينم عن وجود حيرة قوية في السوق لدي المتعاملين , خلال جلسة أندفع السوق لأعلي بشدة ثم تهاوي بشدة أو العكس ثم أغلق السوق عند سعر الافتتاح أو قريبا منه واذا وجد شمعة وهي ليست دوجي ولها ظل سفلي وعلوي طويل فهي ليست شمعة دوجي وتسمي High wave line بالنسبه لليابانين ينظرون الي الشموع ذات الظلال الطويلة سواء علوية أو سفلية علي أنها شموع فقد قدرتها علي تحديد الأتجاة . وبعد هذا النوع من الشموع اذا ظهرت شموع دوجي أو شبية الدوجي فهذا النمط يدل علي سوق منهك القوي وهذه الشموع الصغيره التي تظهر بعد الشموع طويلة الذيل اثناء الصعود يتحكم الثيران في السوق وبعد ظهور شمعة الدوجي طويلة السيقان وبعدها شمعة الدوجي الصغيره اصبحت أشارة لخطر داهم يهدد بتغير اتجاة السوق .


دوجي شاهدة


القبر The Grave stone Doji


هي شمعة دوجي مميزة تتكون الشمعة عندما يتساوي سعر الفتح مع سعر الأغلاق ولكن عند أدني سعر في الجلسة أو اليوم . رغم أنها قد توجد أحيانا عند قيعان الاسواق الا أنها اهم ما يميزها هو قدرتها علي الأعلان عن تغير الأتجاة عندما تظهر عند القمم . وشكلها يدل علي أسمها شاهد القبر هذا النوع من الشموع يظهر غالبا في البورصة وقليل جدا في الفوركس . كلما زاد طول الظل العلوي وكان مستوي الاسعار أعلي , زادت الدلالة السلبية لشمعة شاهد ألقبر .


كما ذكرت من قبل في الفوركس هذه الشمعة ليست كثيرة الظهور واذا ظهرت لا تظهر مثالية ايضا ولكن المهم أنها قامت بعكس الأتجاة وهي المهمة الاساسية لهذة الشمعة . كما نري في هذا المثال أنه عند ظهور الشمعة يحاول الدببة أو الثيران أن يبقو في مسارهم مره أخري ولكن يفشلو في ذلك . يمكنك أن تلاحظ أن هناك تشابة بين شمعة شاهد القبر Grave Stone وبين شمعة الشهاب Shooting star ولكن شمعة شاهد القبر هي شمعة أقوي في الأنعكاس من شمعة الشهاب واشارتها أكثر سلبية .


Belt Hold Lines

شمعة Belt Hold Lines هي شمعة فردية يمكن أن تكون أشارة صعود أو هبوط مثلا عند ظهور شمعة بيضاء قوية تفتح عند أدني مستويات اليوم أو مع وجود ظل سفلي صغير جدا عند قاع بعد ترند هابط كما في الشكل فأن صعودا قويا سوف يبدأ . ولكن اذا أتي اليوم التالي واستمر في الهبوط فهذا يعني أستمرار الترند الهابط .


والعكس هو ظهور شمعة سوداء تفتح عند أعلي سعر في الجلسه أو قريبا جدا منه وتستمر في الهبوط طوال الجلسه أو اليوم , وعند ظهور هذه الشمعة فهذا ينبأ بأنعكاس قريب قادم كلما زاد طول الشمعة كلما ازدادت تأثيرا وقوة . ولكن اذا أتي اليوم التالي وأغلق فوق الشمعة فهذا يعني أستمرار الصعود .


http://fx7days.com/school/viewarticle.aspx?id=c3f0f5ae-f853-477e-8d22-cee74467a7c5
 
كتاب قاموس الشموع اليابانية
بسم الله الرحمن الرحيم

السلام عليكم ورحمة الله

كتاب قاموس الشموع اليابانية

تعرف على كل أشكال الشموع اليابانية والصور

تعرف على الشموع التالية :

شمعة تسريع القمم الخضراء

شمعة الرجل المشنوق

شمعة الحرامي الخضراء


شموع الجنود الثلاثة

شمعة الابتلاع الخضراء

الشمعة الحمراء المثقوبة

شمعة نجمة الصباح

شمعة النجمة الواطئة

شمعة فجوة تاسكي الأوطأ


شمعة تسريع القمم الحمراء


شمعة المطرقة / الهامر


شمعة الشهاب / النيزك


شمعة المصاصة المقلوبة

شمعة الحرامي الحمراء

شمعة المصاصة المقلوبة


شمعة الابتلاع الحمراء


الشمعة الخضراء المثقوبة


الشموع الساقطة..


شموع الغربان الثلاثة


شمعة نجمة المساء


شمعة النجمة العالية


شمعة الفجوة العالية وابتلاع الغراب


شمعة فجوة تاسكي العالية


شمعة نجم دوجي المسائي

شمعة دوجي الصباحية


نمط شمعة فرصة التاجر


شمعة خضراء طويلة + الدبور في اتجاه صاعد


شمعة التابوت عند الدعم في اتجاه هابط


شمعة ماربوز الخضراء + الدبور في اتجاه صاعد


شمعة الدبور عند الدعم في اتجاه هابط


شمعة الدبور عند مقاومة في اتجاه صاعد

نمط صليب الحرامي


شمعة التابوت عند دعم في اتجاه هابط


شمعة دوجي اليلية


شمعة ماربوز + الدبور في اتجاه هابط


شمعة دوجي اليلية


شمعة حمراء وطويلة + دوجي في اتجاه هابط


الحرامي المتوسط

الكتاب مرفق
----------

paperclip.png
الملفات المرفقة

http://forex-masr.com/showthread.php?13785-كتاب-قاموس-الشموع-اليابانية
 
=============================


الرئيسية / مقالات وآراء / الشمعة الإنعكاسية وطريقة المضاربة عند إكتمالها
reversal-candle.png

الشمعة الإنعكاسية وطريقة المضاربة عند إكتمالها
فيصل السوادي 19 سبتمبر، 2016 مقالات وآراء 2 تعليقان

الشمعة الإنعكاسية تعتبر إحدى أنواع النماذج الإنعكاسية قصيرة الأجل Short Term Reversal Pattern وذلك لأنها تحتاج فعلياً لشمعة واحدة فقط حتى يكتمل النموذج ، من أهم الشروط الواجب توفرها حتى يكتمل هذا النموذج للشمعة هي الشروط الثلاث أدناه.

1- وجود فجوة سابقة قبل تكون الشمعة الإنعكاسية حتى تحصل على القوة المطلوبة لعكس السعر.

2- يجب أن تأتي الشمعة في منطقة معاكسة لحركة الشموع السابقة حتى تعكس الحركة ويذهب السعر في إتجاه آخر.

3- يجب أن يحدث الإغلاق للشمعة الإنعكاسية قريب او على نفس مستوى إغلاق الشمعة السابقة.

هذه الشمعة تسمى باللغة الانجليزية The Key Reversal Candle لمن أحب الإستزادة عن المصادر المكتوبة بلغة أخرى ، الآن لنشاهد الشكل العام للشمعة ثم نقارن ذلك بشكل اكبر على الشارت..

نلاحظ اكتمال الشروط الثلاثة كما تم توضيحه بالشكل ، فجوة سابقة ثم اغلاق قريب من اغلاق السعر السابق والشمعة الانعكاسية عكس الحركة الهابطة السابقة.


نفس الشمعة الإنعكاسية في قمة (عاكسة سلبية للسعر)..


لنأخذ بعض الأمثلة من الشارت ونعلق عليها:


نموذج لشمعة انعكاسية على سهم إسمنت الجوف ، الشمعة الأخرى تعتبر شمعة منهكة Exhausted Bar وسيتم فرد مقال لاحق عنها بإذن الله.


في الشارت أعلاه ثلاث نماذج لشموع انعكاسية على سهم الجبس منها اثنان انعكاسي ايجابي وواحد انعكاسي سلبي ، توفر الشروط الثلاثة مهم جداً حتى تعطي مصداقية للشمعة.


شموع رقم 1 و 2 و 3 نماذج لشموع انعكاسية على سهم انابيب ، شمعة رقم 4 كانت ايضاً شمعة انعكاسية ولكن لم يتم تفعيل الصفقة بها بسبب كسر السعر لأدنى سعر للشمعة الانعكاسية قبل تخطي اعلى سعر للشمعة الانعكاسية


في هذا المثال على سهم طيبة لم يتم الدخول وتفعيل الصفقة بعد تكون الشمعة الانعكاسية عند رقم 2 وذلك بسبب ان السعر كسر ادنى سعر للشمعة الانعكاسية قبل ان يتخطى اعلى سعر للشمعة الانعكاسية.


هذا الأمر يعتبر الشرط رقم 4 إن صح التعبير ، لأن هذه الشمعة تعتبر انعكاسية متوقع بعدها ان ينعكس السعر ، لذلك لا اقوم بتفعيل صفقة ابداً حتى ولو بدت نموذجية الا اذا تعدى السعر للسهم اعلى سعر للشمعة بشرط ان لا يهبط ادنى من ادنى سعر للشمعة قبل ذلك.

هذا النوع من الشموع يعتبر من الشموع العاكسة للاتجاه ومهم جداً التدرب عليها ومحاولة ايجادها على شارتات كثيرة حتى تتعود على تمييزها فور ظهورها على الشارت. من القليل مشاهدة مثل هذا النوع من الشموع على العملات بسبب عدم وجود فجوات مثل سوق الأسهم.

المصدر

ترندات576 × 540
 
التعديل الأخير:
عن شمعة الحرامي انها تاتي بعد اتجاه لتعكسه غالبا ويشترط فيها الاتكسر لو الشمعة السابقة ويفضل ان تتجاوز 50% من الشمعة السابقة سواء صعودا او هبوطا
14759_candel+21.PNG

14759_candel+20.PNG


ايضا من شروطها :
تكون فيها الشمعة السابقة كبيرة ، والتي تليها صغيرة

( مدسوسة ) مثل الحرامي وعادة تسمى الشمعة المدسوسة لأن الشمعة الثانية تكون معشعشة داخل الشمعة الأولى .


الشمعة الأولى عادة بيكون له جسم كبير والشمعة الثانية جسم حقيقي أصغر من الأول ، والظلال ليست ضرورية ..


** للعلم : ليس من الضروري أن تكون الشمعة الثانية معشعشة لكنه يفضل ذلك

التوقع هو احتمال : عكس الاتجاه السابق
والله اعلي واعلم
 
Understanding Japanese Candlestick Patterns
Posted by Bigtrends on June 25, 2015 7:35 AM


Understanding Japanese Candlestick Patterns
Inside Japanese Candlestick Trading Patterns, History & Basics

by optionalpha.com and stockcharts.com

Japanese candlestick patterns have been around for centuries. Originally they were used by merchants to help them predict and profit from rice trading. You could say that they have really passed the test of time and are a "seasoned" tool for any financial market. If they weren't somewhat reliable then they would have faded away many years ago - but they are still being used all over the world even today.

History is not a favorite pastime for some traders. Most traders don't care what happened in the past, they only focus on where the market is going now. For me, I'm an avid student of the markets. Its useful to read a lot of books about early trading in the 30's and 40's as well as some of the more "modern" theories of technical analysis and portfolio management. This quick history of Candlestick Patterns hopefully will help shed some light on how to really use them to profit.

18th Century Rice Trading

While there are accounts of candlesticks being used as far back as the 17th century, the first detailed documentation of candlestick patterns can be traced back to an 18th century Japanese businessman named Munehisa Homma. Munehisa used candlesticks to chart and track rice contracts.

Everyone at the time was tracking rice contracts, but what he did was take an emotional approach to the market - analyzing fear, greed, and the herd mentality. He found a way to accurately observe the behavior of the masses and manipulate them to his advantage.

He tracked the opening and closing price along with the high and low of the day and placed them on a chart. This graphic representation was a series of columns that looked like candlesticks, hence the name.

He took an extremely chaotic market and brought some order and insight to why prices did what they did. The patterns that repeated themselves over and over again became his bedrock for future price moves. Homma made huge contributions to early candlestick charting.

There are some reports and sources that say he would consistently make dozens of profitable trades. Rumors are that he gained the equivalent of over $10 billion in today's dollars. He could have very well been the most successful trader in all of history...

Where Did The Crazy Names Come From?

Remember, we are still in 18th century Japan here. Munehisa needed a way to link the chart patterns to some visual concept - the tug of war between buyers and sellers in the market. With this, he labeled the names of specific candlestick patterns from mostly military concepts.
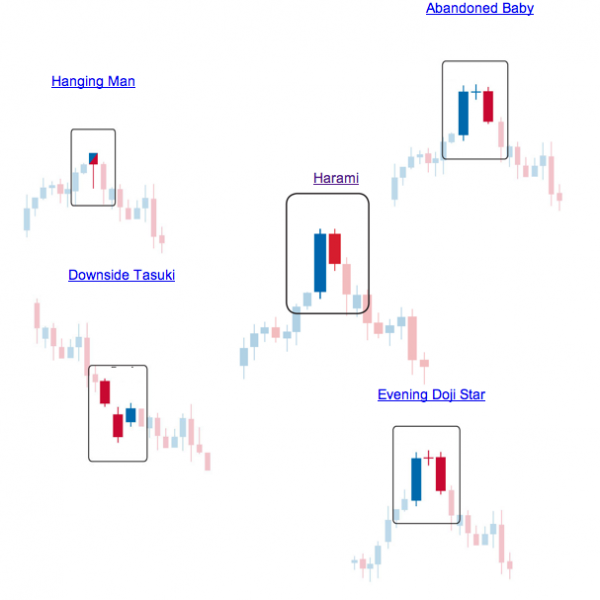


Today some of these patterns have kept their Japanese names such as the Doji Star, Harami, and Tasuki. Others have been translated into an English equivalent like the Abandoned Baby or Hanging Man. Either way, the patterns are still the same today as they were back then and just as powerful for your trading.

History

While this early version of technical analysis was different from the US version initiated by Charles Dow around 1900, many of the guiding principles were very similar:

* The "what" (price action) is more important than the "why" (news, earnings, and so on).
* All known information is reflected in the price.
* Buyers and sellers move markets based on expectations and emotions (fear and greed).
* Markets fluctuate.
* The actual price may not reflect the underlying value.

Formation

In order to create a candlestick chart, you must have a data set that contains open, high, low and close values for each time period you want to display. The hollow or filled portion of the candlestick is called "the body" (also referred to as "the real body"). The long thin lines above and below the body represent the high/low range and are called "shadows" (also referred to as "wicks" and "tails"). The high is marked by the top of the upper shadow and the low by the bottom of the lower shadow. If the stock closes higher than its opening price, a hollow candlestick is drawn with the bottom of the body representing the opening price and the top of the body representing the closing price. If the stock closes lower than its opening price, a filled candlestick is drawn with the top of the body representing the opening price and the bottom of the body representing the closing price.
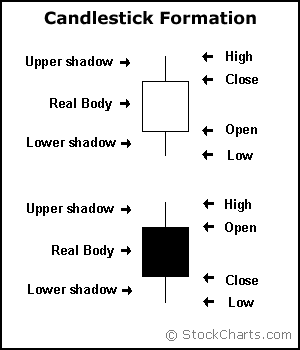


Compared to traditional bar charts, many traders consider candlestick charts more visually appealing and easier to interpret. Each candlestick provides an easy-to-decipher picture of price action. Immediately a trader can compare the relationship between the open and close as well as the high and low. The relationship between the open and close is considered vital information and forms the essence of candlesticks. Hollow candlesticks, where the close is greater than the open, indicate buying pressure. Filled candlesticks, where the close is less than the open, indicate selling pressure.

Long Versus Short Bodies

Generally speaking, the longer the body is, the more intense the buying or selling pressure. Conversely, short candlesticks indicate little price movement and represent consolidation.
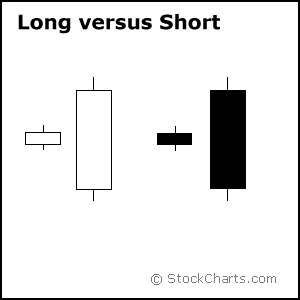


Long white candlesticks show strong buying pressure. The longer the white candlestick is, the further the close is above the open. This indicates that prices advanced significantly from open to close and buyers were aggressive. While long white candlesticks are generally bullish, much depends on their position within the broader technical picture. After extended declines, long white candlesticks can mark a potential turning point or support level. If buying gets too aggressive after a long advance, it can lead to excessive bullishness.

Long black candlesticks show strong selling pressure. The longer the black candlestick is, the further the close is below the open. This indicates that prices declined significantly from the open and sellers were aggressive. A fter a long advance, a long black candlestick can foreshadow a turning point or mark a future resistance level. After a long decline a long black candlestick can indicate panic or capitulation.
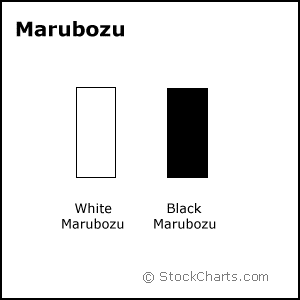


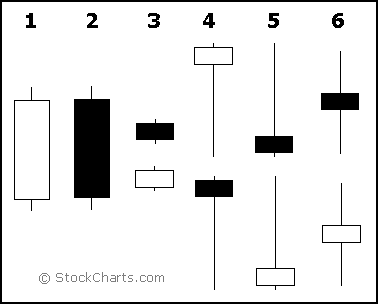
Even more potent long candlesticks are the Marubozu brothers, Black and White. Marubozu do not have upper or lower shadows and the high and low are represented by the open or close. A White Marubozu forms when the open equals the low and the close equals the high. This indicates that buyers controlled the price action from the first trade to the last trade. Black Marubozu form when the open equals the high and the close equals the low. This indicates that sellers controlled the price action from the first trade to the last trade.

Long Versus Short Shadows

The upper and lower shadows on candlesticks can provide valuable information about the trading session. Upper shadows represent the session high and lower shadows the session low. Candlesticks with short shadows indicate that most of the trading action was confined near the open and close. Candlesticks with long shadows show that prices extended well past the open and close.
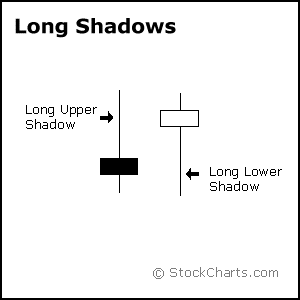


Candlesticks with a long upper shadow and short lower shadow indicate that buyers dominated during the session, and bid prices higher. However, sellers later forced prices down from their highs, and the weak close created a long upper shadow. Conversely, candlesticks with long lower shadows and short upper shadows indicate that sellers dominated during the session and drove prices lower. However, buyers later resurfaced to bid prices higher by the end of the session and the strong close created a long lower shadow.
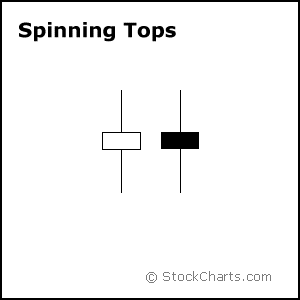


Candlesticks with a long upper shadow, long lower shadow and small real body are called spinning tops. One long shadow represents a reversal of sorts; spinning tops represent indecision. The small real body (whether hollow or filled) shows little movement from open to close, and the shadows indicate that both bulls and bears were active during the session. Even though the session opened and closed with little change, prices moved significantly higher and lower in the meantime. Neither buyers nor sellers could gain the upper hand and the result was a standoff. After a long advance or long white candlestick, a spinning top indicates weakness among the bulls and a potential change or interruption in trend. After a long decline or long black candlestick, a spinning top indicates weakness among the bears and a potential change or interruption in trend.

Doji

Doji are important candlesticks that provide information on their own and as components of in a number of important patterns. Doji form when a security's open and close are virtually equal. The length of the upper and lower shadows can vary and the resulting candlestick looks like a cross, inverted cross or plus sign. Alone, doji are neutral patterns. Any bullish or bearish bias is based on preceding price action and future confirmation. The word "Doji" refers to both the singular and plural form.
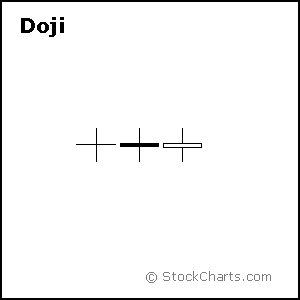


Ideally, but not necessarily, the open and close should be equal. While a doji with an equal open and close would be considered more robust, it is more important to capture the essence of the candlestick. Doji convey a sense of indecision or tug-of-war between buyers and sellers. Prices move above and below the opening level during the session, but close at or near the opening level. The result is a standoff. Neither bulls nor bears were able to gain control and a turning point could be developing.
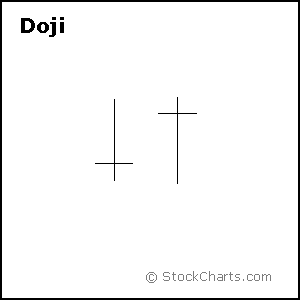


Different securities have different criteria for determining the robustness of a doji. A $20 stock could form a doji with a 1/8 point difference between open and close, while a $200 stock might form one with a 1 1/4 point difference. Determining the robustness of the doji will depend on the price, recent volatility, and previous candlesticks. Relative to previous candlesticks, the doji should have a very small body that appears as a thin line. Steven Nison notes that a doji that forms among other candlesticks with small real bodies would not be considered important. However, a doji that forms among candlesticks with long real bodies would be deemed significant.

Doji and Trend

The relevance of a doji depends on the preceding trend or preceding candlesticks. After an advance, or long white candlestick, a doji signals that the buying pressure is starting to weaken. After a decline, or long black candlestick, a doji signals that selling pressure is starting to diminish. Doji indicate that the forces of supply and demand are becoming more evenly matched and a change in trend may be near. Doji alone are not enough to mark a reversal and further confirmation may be warranted.
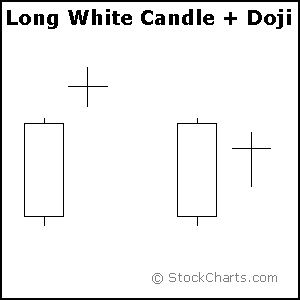


After an advance or long white candlestick, a doji signals that buying pressure may be diminishing and the uptrend could be nearing an end. Whereas a security can decline simply from a lack of buyers, continued buying pressure is required to sustain an uptrend. Therefore, a doji may be more significant after an uptrend or long white candlestick. Even after the doji forms, further downside is required for bearish confirmation. This may come as a gap down, long black candlestick, or decline below the long white candlestick's open. After a long white candlestick and doji, traders should be on the alert for a potential evening doji star.
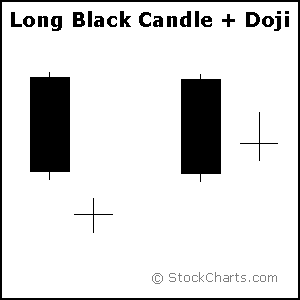


After a decline or long black candlestick, a doji indicates that selling pressure may be diminishing and the downtrend could be nearing an end. Even though the bears are starting to lose control of the decline, further strength is required to confirm any reversal. Bullish confirmation could come from a gap up, long white candlestick or advance above the long black candlestick's open. After a long black candlestick and doji, traders should be on the alert for a potential morning doji star.

Long-Legged Doji


Long-legged doji have long upper and lower shadows that are almost equal in length. These doji reflect a great amount of indecision in the market. Long-legged doji indicate that prices traded well above and below the session's opening level, but closed virtually even with the open . After a whole lot of yelling and screaming, the end result showed little change from the initial open.
 
Dragon Fly and Gravestone Doji


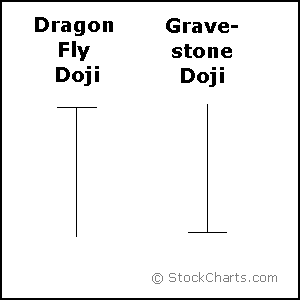
Dragon Fly Doji

Dragon fly doji form when the open, high and close are equal and the low creates a long lower shadow. The resulting candlestick looks like a "T" with a long lower shadow and no upper shadow. Dragon fly doji indicate that sellers dominated trading and drove prices lower during the session. By the end of the session, buyers resurfaced and pushed prices back to the opening level and the session high.

The reversal implications of a dragon fly doji depend on previous price action and future confirmation. The long lower shadow provides evidence of buying pressure, but the low indicates that plenty of sellers still loom. After a long downtrend, long black candlestick, or at support, a dragon fly doji could signal a potential bullish reversal or bottom. After a long uptrend, long white candlestick or at resistance, the long lower shadow could foreshadow a potential bearish reversal or top. Bearish or bullish confirmation is required for both situations.

Gravestone Doji

Gravestone doji form when the open, low and close are equal and the high creates a long upper shadow. The resulting candlestick looks like an upside down "T" with a long upper shadow and no lower shadow. Gravestone doji indicate that buyers dominated trading and drove prices higher during the session. However, by the end of the session, sellers resurfaced and pushed prices back to the opening level and the session low.

As with the dragon fly doji and other candlesticks, the reversal implications of gravestone doji depend on previous price action and future confirmation. Even though the long upper shadow indicates a failed rally, the intraday high provides evidence of some buying pressure. After a long downtrend, long black candlestick, or at support, focus turns to the evidence of buying pressure and a potential bullish reversal. After a long uptrend, long white candlestick or at resistance, focus turns to the failed rally and a potential bearish reversal. Bearish or bullish confirmation is required for both situations.

Before turning to the single and multiple candlestick patterns, there are a few general guidelines to cover.

Bulls Versus Bears

A candlestick depicts the battle between Bulls (buyers) and Bears (sellers) over a given period of time. An analogy to this battle can be made between two football teams, which we can also call the Bulls and the Bears. The bottom (intra-session low) of the candlestick represents a touchdown for the Bears and the top (intra-session high) a touchdown for the Bulls. The closer the close is to the high, the closer the Bulls are to a touchdown. The closer the close is to the low, the closer the Bears are to a touchdown. While there are many variations, I have narrowed the field to 6 types of games (or candlesticks):


1. Long white candlesticks indicate that the Bulls controlled the ball (trading) for most of the game.
2. Long black candlesticks indicate that the Bears controlled the ball (trading) for most of the game.
3. Small candlesticks indicate that neither team could move the ball and prices finished about where they started.
4. A long lower shadow indicates that the Bears controlled the ball for part of the game, but lost control by the end and the Bulls made an impressive comeback.
5. A long upper shadow indicates that the Bulls controlled the ball for part of the game, but lost control by the end and the Bears made an impressive comeback.
6. A long upper and lower shadow indicates that the both the Bears and the Bulls had their moments during the game, but neither could put the other away, resulting in a standoff.

What Candlesticks Don't Tell You

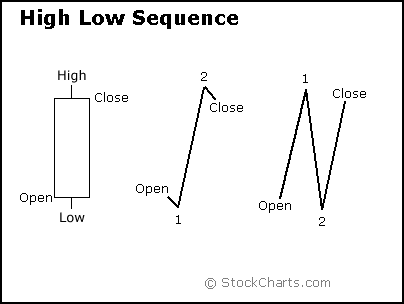
Candlesticks do not reflect the sequence of events between the open and close, only the relationship between the open and the close. The high and the low are obvious and indisputable, but candlesticks (and bar charts) cannot tell us which came first.


With a long white candlestick, the assumption is that prices advanced most of the session. However, based on the high/low sequence, the session could have been more volatile. The example above depicts two possible high/low sequences that would form the same candlestick. The first sequence shows two small moves and one large move: a small decline off the open to form the low, a sharp advance to form the high, and a small decline to form the close. The second sequence shows three rather sharp moves: a sharp advance off the open to form the high, a sharp decline to form the low, and a sharp advance to form the close. The first sequence portrays strong, sustained buying pressure, and would be considered more bullish. The second sequence reflects more volatility and some selling pressure. These are just two examples, and there are hundreds of potential combinations that could result in the same candlestick. Candlesticks still offer valuable information on the relative positions of the open, high, low and close. However, the trading activity that forms a particular candlestick can vary.

Prior Trend

Some analysts note that for a pattern to qualify as a reversal pattern, there should be a prior trend to reverse. Bullish reversals require a preceding downtrend and bearish reversals require a prior uptrend. The direction of the trend can be determined using trend lines, moving averages, peak/trough analysis or other aspects of technical analysis. A downtrend might exist as long as the security was trading below its down trend line, below its previous reaction high or below a specific moving average. The length and duration will depend on individual preferences. However, because candlesticks are short-term in nature, it is usually best to consider the last 1-4 weeks of price action.

Candlestick Positioning


Star Position
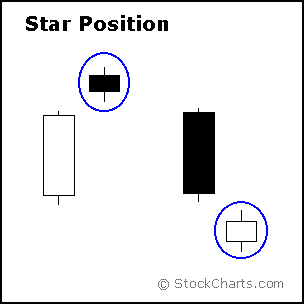
A candlestick that gaps away from the previous candlestick is said to be in star position. The first candlestick usually has a large real body, but not always, and the second candlestick in star position has a small real body. Depending on the previous candlestick, the star position candlestick gaps up or down and appears isolated from previous price action. The two candlesticks can be any combination of white and black. Doji, hammers, shooting stars and spinning tops have small real bodies, and can form in the star position. Later we will examine 2- and 3-candlestick patterns that utilize the star position.


Harami Position

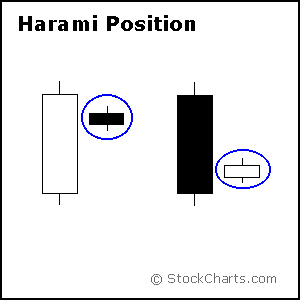
A candlestick that forms within the real body of the previous candlestick is in Harami position. Harami means pregnant in Japanese and the second candlestick is nestled inside the first. The first candlestick usually has a large real body and the second a smaller real body than the first. The shadows (high/low) of the second candlestick do not have to be contained within the first, though it's preferable if they are. Doji and spinning tops have small real bodies, and can form in the harami position as well. Later we will examine candlestick patterns that utilize the harami position.

Long Shadow Reversals

There are two pairs of single candlestick reversal patterns made up of a small real body, one long shadow and one short or non-existent shadow. Generally, the long shadow should be at least twice the length of the real body, which can be either black or white. The location of the long shadow and preceding price action determine the classification.

The first pair, Hammer and Hanging Man, consists of identical candlesticks with small bodies and long lower shadows. The second pair, Shooting Star and Inverted Hammer, also contains identical candlesticks, except, in this case, they have small bodies and long upper shadows. Only preceding price action and further confirmation determine the bullish or bearish nature of these candlesticks. The Hammer and Inverted Hammer form after a decline and are bullish reversal patterns, while the Shooting Star and Hanging Man form after an advance and are bearish reversal patterns.

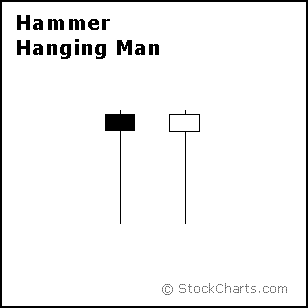
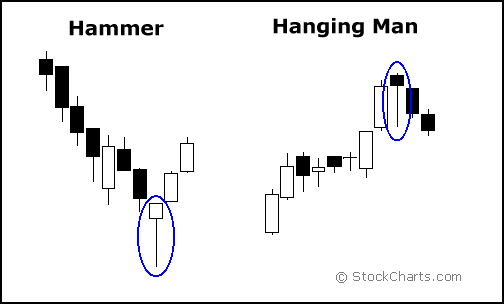
Hammer and Hanging Man

The Hammer and Hanging Man look exactly alike, but have different implications based on the preceding price action. Both have small real bodies (black or white), long lower shadows and short or non-existent upper shadows. As with most single and double candlestick formations, the Hammer and Hanging Man require confirmation before action.


The Hammer is a bullish reversal pattern that forms after a decline. In addition to a potential trend reversal, hammers can mark bottoms or support levels. After a decline, hammers signal a bullish revival. The low of the long lower shadow implies that sellers drove prices lower during the session. However, the strong finish indicates that buyers regained their footing to end the session on a strong note. While this may seem enough to act on, hammers require further bullish confirmation. The low of the hammer shows that plenty of sellers remain. Further buying pressure, and preferably on expanding volume, is needed before acting. Such confirmation could come from a gap up or long white candlestick. Hammers are similar to selling climaxes, and heavy volume can serve to reinforce the validity of the reversal.


The Hanging Man is a bearish reversal pattern that can also mark a top or resistance level. Forming after an advance, a Hanging Man signals that selling pressure is starting to increase. The low of the long lower shadow confirms that sellers pushed prices lower during the session. Even though the bulls regained their footing and drove prices higher by the finish, the appearance of selling pressure raises the yellow flag. As with the Hammer, a Hanging Man requires bearish confirmation before action. Such confirmation can come as a gap down or long black candlestick on heavy volume.

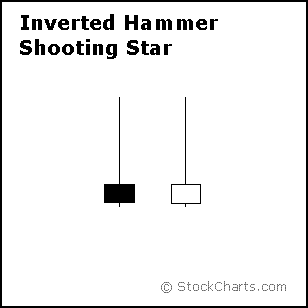
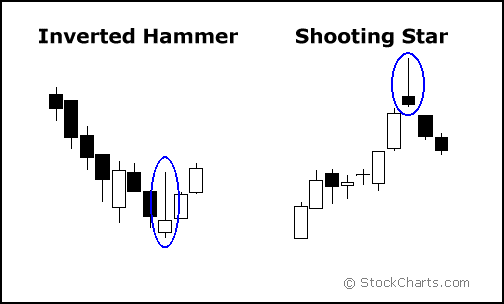
Inverted Hammer and Shooting Star

The Inverted Hammer and Shooting Star look exactly alike, but have different implications based on previous price action. Both candlesticks have small real bodies (black or white), long upper shadows and small or nonexistent lower shadows. These candlesticks mark potential trend reversals, but require confirmation before action.


The Shooting Star is a bearish reversal pattern that forms after an advance and in the star position, hence its name. A Shooting Star can mark a potential trend reversal or resistance level. The candlestick forms when prices gap higher on the open, advance during the session and close well off their highs. The resulting candlestick has a long upper shadow and small black or white body. After a large advance (the upper shadow), the ability of the bears to force prices down raises the yellow flag. To indicate a substantial reversal, the upper shadow should relatively long and at least 2 times the length of the body. Bearish confirmation is required after the Shooting Star and can take the form of a gap down or long black candlestick on heavy volume.


The Inverted Hammer looks exactly like a Shooting Star, but forms after a decline or downtrend. Inverted Hammers represent a potential trend reversal or support levels. After a decline, the long upper shadow indicates buying pressure during the session. However, the bulls were not able to sustain this buying pressure and prices closed well off of their highs to create the long upper shadow. Because of this failure, bullish confirmation is required before action. An Inverted Hammer followed by a gap up or long white candlestick with heavy volume could act as bullish confirmation.

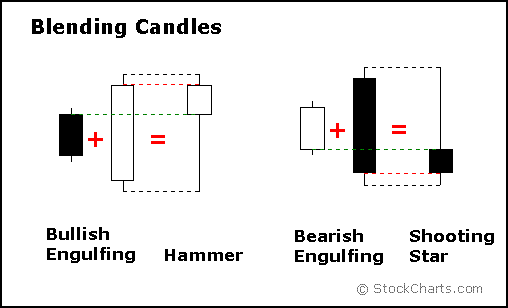
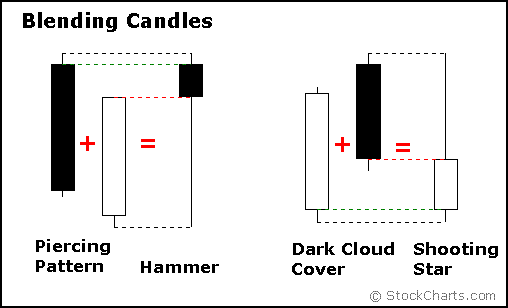
Blending Candlesticks

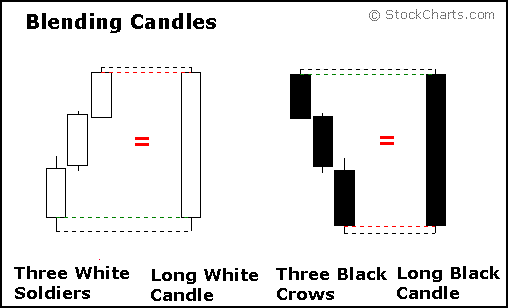
Candlestick patterns are made up of one or more candlesticks and can be blended together to form one candlestick. This blended candlestick captures the essence of the pattern and can be formed using the following:

* The open of first candlestick
* The close of the last candlestick
* The high and low of the pattern


By using the open of the first candlestick, close of the second candlestick, and high/low of the pattern, a Bullish Engulfing Pattern or Piercing Pattern blends into a Hammer. The long lower shadow of the Hammer signals a potential bullish reversal. As with the Hammer, both the Bullish Engulfing Pattern and the Piercing Pattern require bullish confirmation.


Blending the candlesticks of a Bearish Engulfing Pattern or Dark Cloud Cover Pattern creates a Shooting Star. The long, upper shadow of the Shooting Star indicates a potential bearish reversal. As with the Shooting Star, Bearish Engulfing, and Dark Cloud Cover Patterns require bearish confirmation.


More than two candlesticks can be blended using the same guidelines: open from the first, close from the last and high/low of the pattern. Blending Three White Soldiers creates a long white candlestick and blending Three Black Crows creates a long black candlestick.

How To Easily Find Patterns

If you are just starting out it may be hard to find reliable patterns right? Well now most brokers have a tool that lets you scan for particular candlestick patterns instantly and accurately.

Now you should have a basic understanding of how to find advanced candlestick patterns and use them to profit. The patterns and strategies talked about above are only a few of the many candlestick patterns that can help you become a more reliable and consistent trader.

Mr. Candlestick - Steve Nison

As always, give credit where credit is due...

In 1989, Steve Nison published an article in Futures Magazine that first introduced the western world to candlestick patterns. He is still very active and remains one of the foremost experts on candlestick patterns. Since the growth of candlestick patterns has really taken off since 2000 with more and more investors trading online. NIson's primary book is Japanese Candlestick Charting Techniques.

If you are into swing trading these days then you should know two things, technical analysis and candlestick patterns. Both of these tools are a must if you want to become a winning trader no matter what market you like to trade or what contracts or instruments you want to trade.

To tell you truth, in the beginning, you might get overwhelmed by the number of technical indicators that are available. What you need to do is to choose only two or three and then master them. One should be a trending indicator and the other should be a ranging indicator. I think, mastering three indicators is the best for you. Don't go for more than three indicators.


Courtesy of optionalpha.com and stockcharts.com


http://www.bigtrends.com/education/understanding-japanese-candlestick-patterns/
 

مشاركتك الجميلة .. قاعد اقرأها مع بعض الملاحظات و المؤشرات اللي في موقع أسما بعمق :) ( الله يرده بالسلامة )
انت ادرى ... فالكتابة في المسائل الفنية المتعلقة بإتجاه مؤشر السوق و الاسهم فيها مسؤولية أدبية كبيرة ..

خصوصا ان الضغوط النفسية تجعل من يقرأها يبحث فيها عن ما يتفق و يدعم هواه و قراره
لا
عن حقيقة مسار السوق و الاسهم ..........
 
عودة
أعلى